Muscatine Power and Water
Communications Utility
Statement of Revenues, Expenses and Changes in Net Position
June 2015
Muscatine Power and Water
Communications Utility
Table of Contents
Page
Statements ofRevenues, Expenses, and Changes in Net Position
1-2
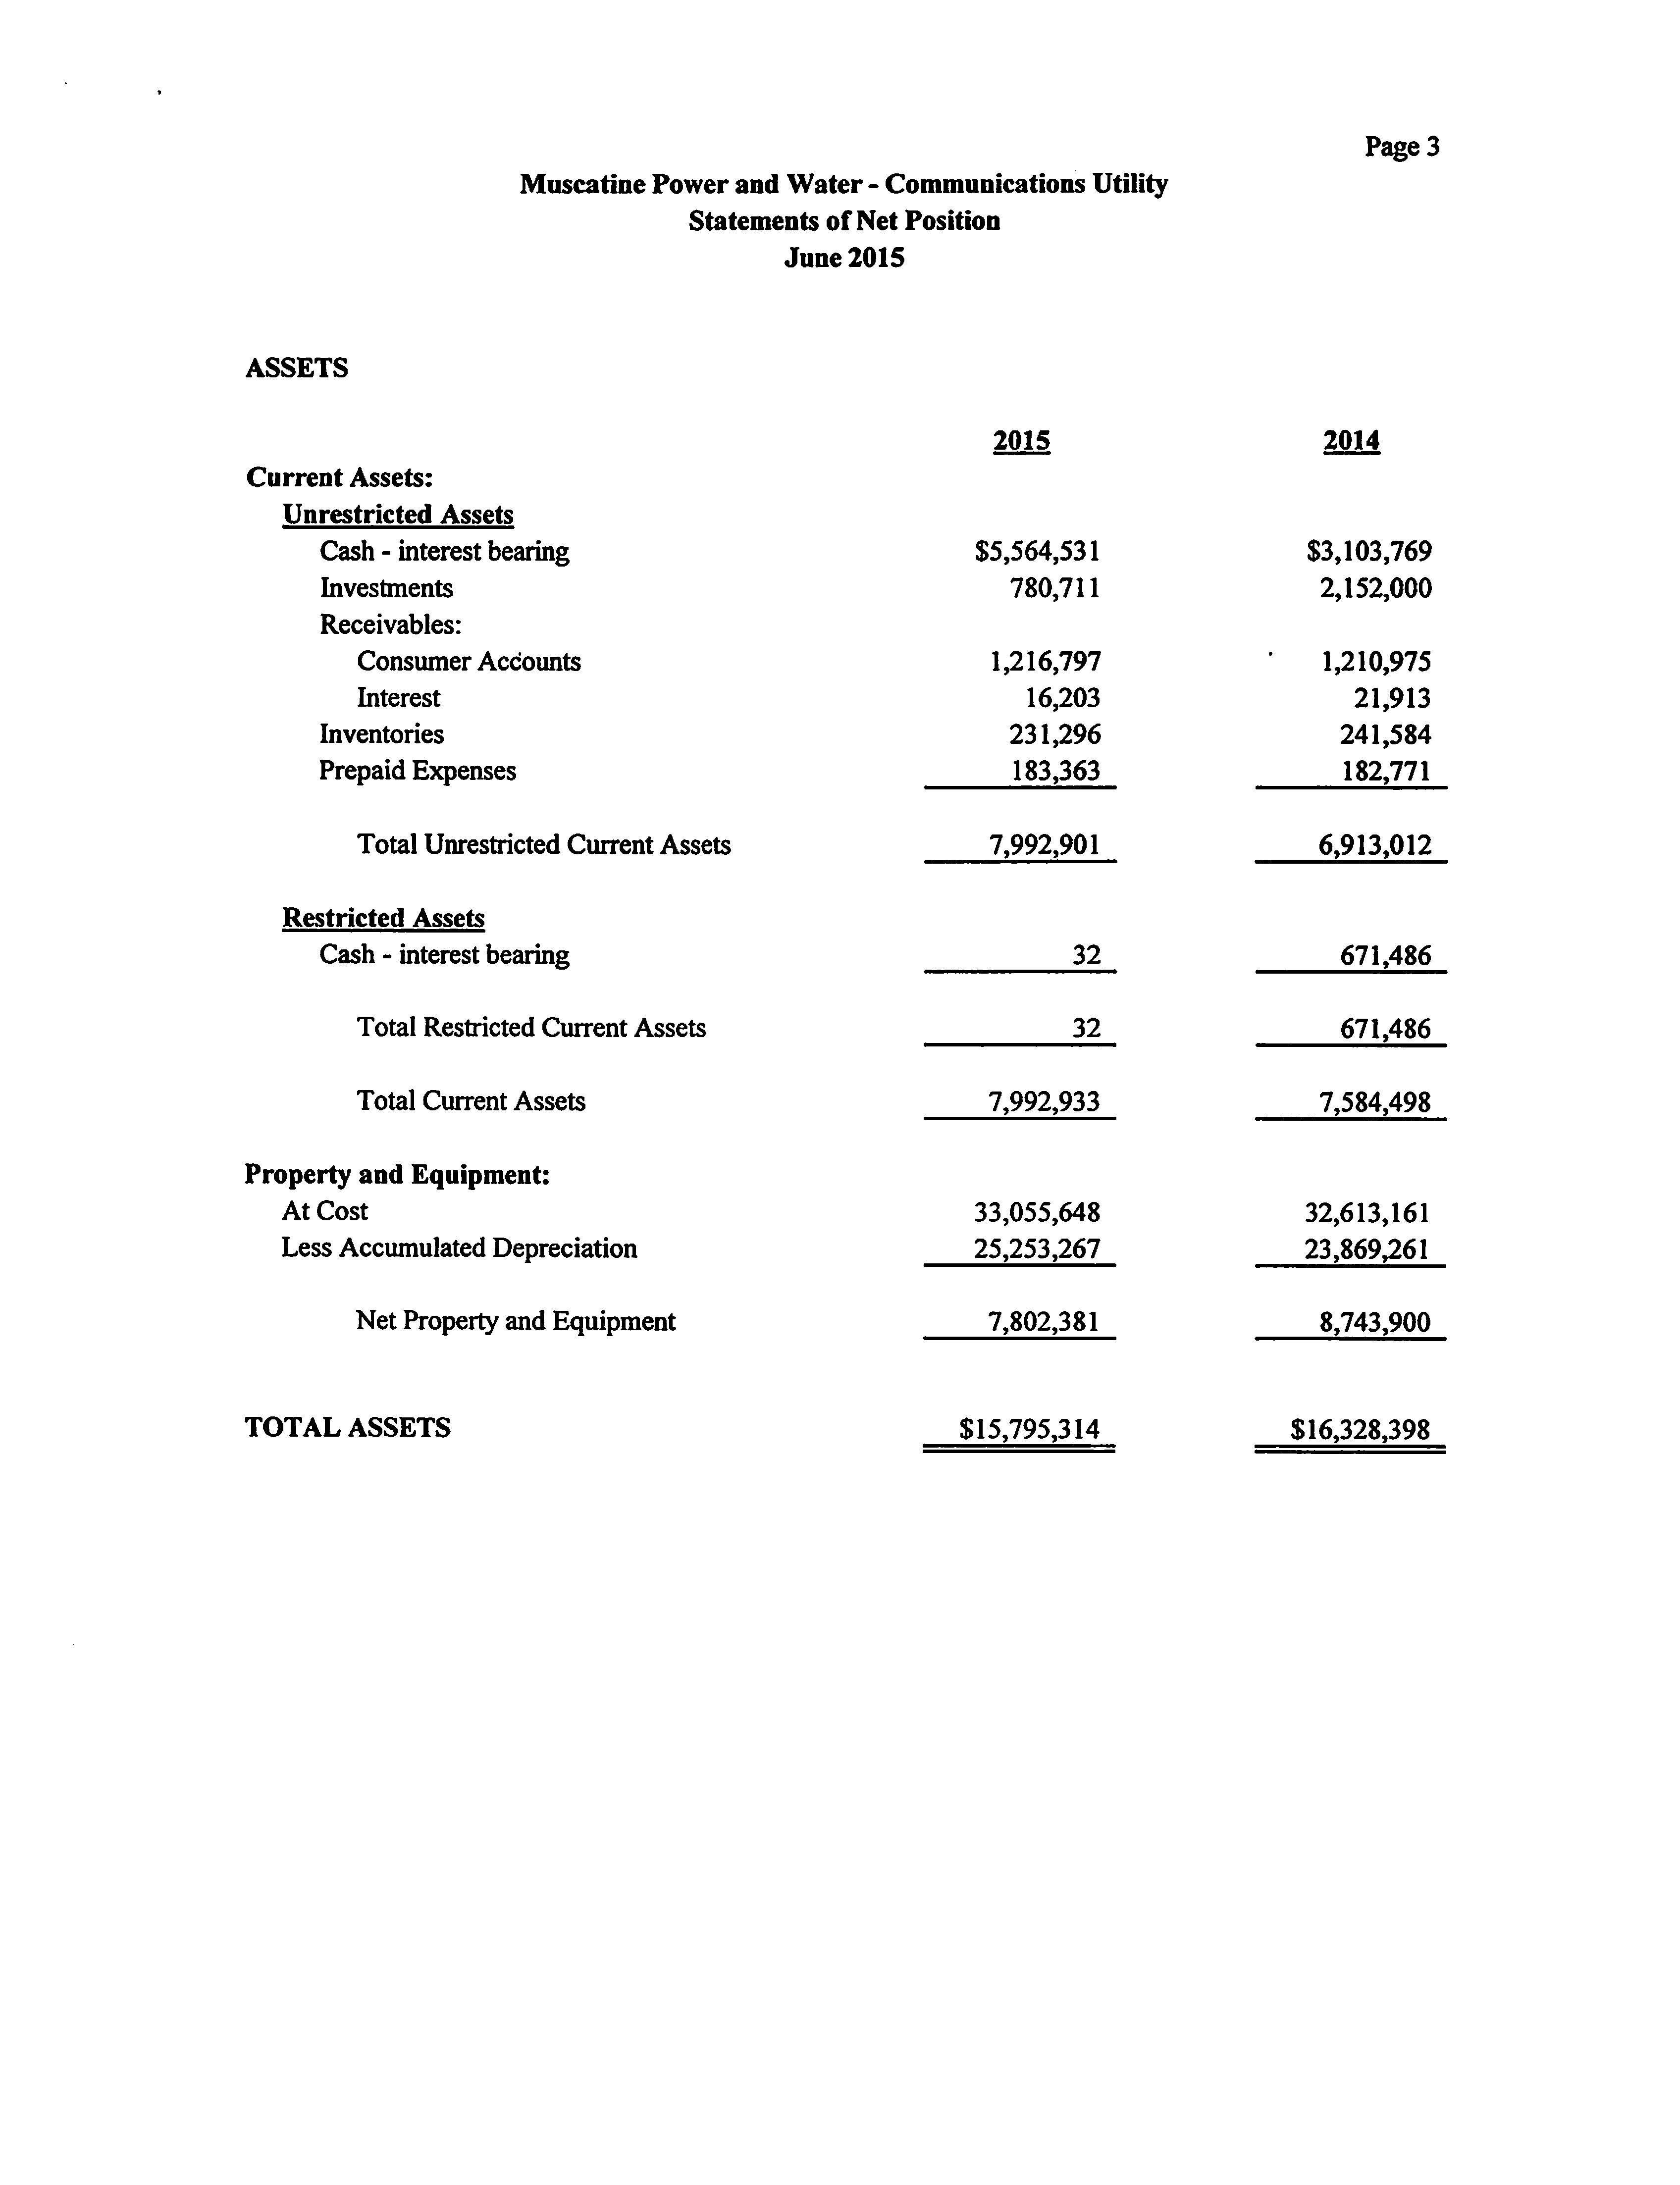
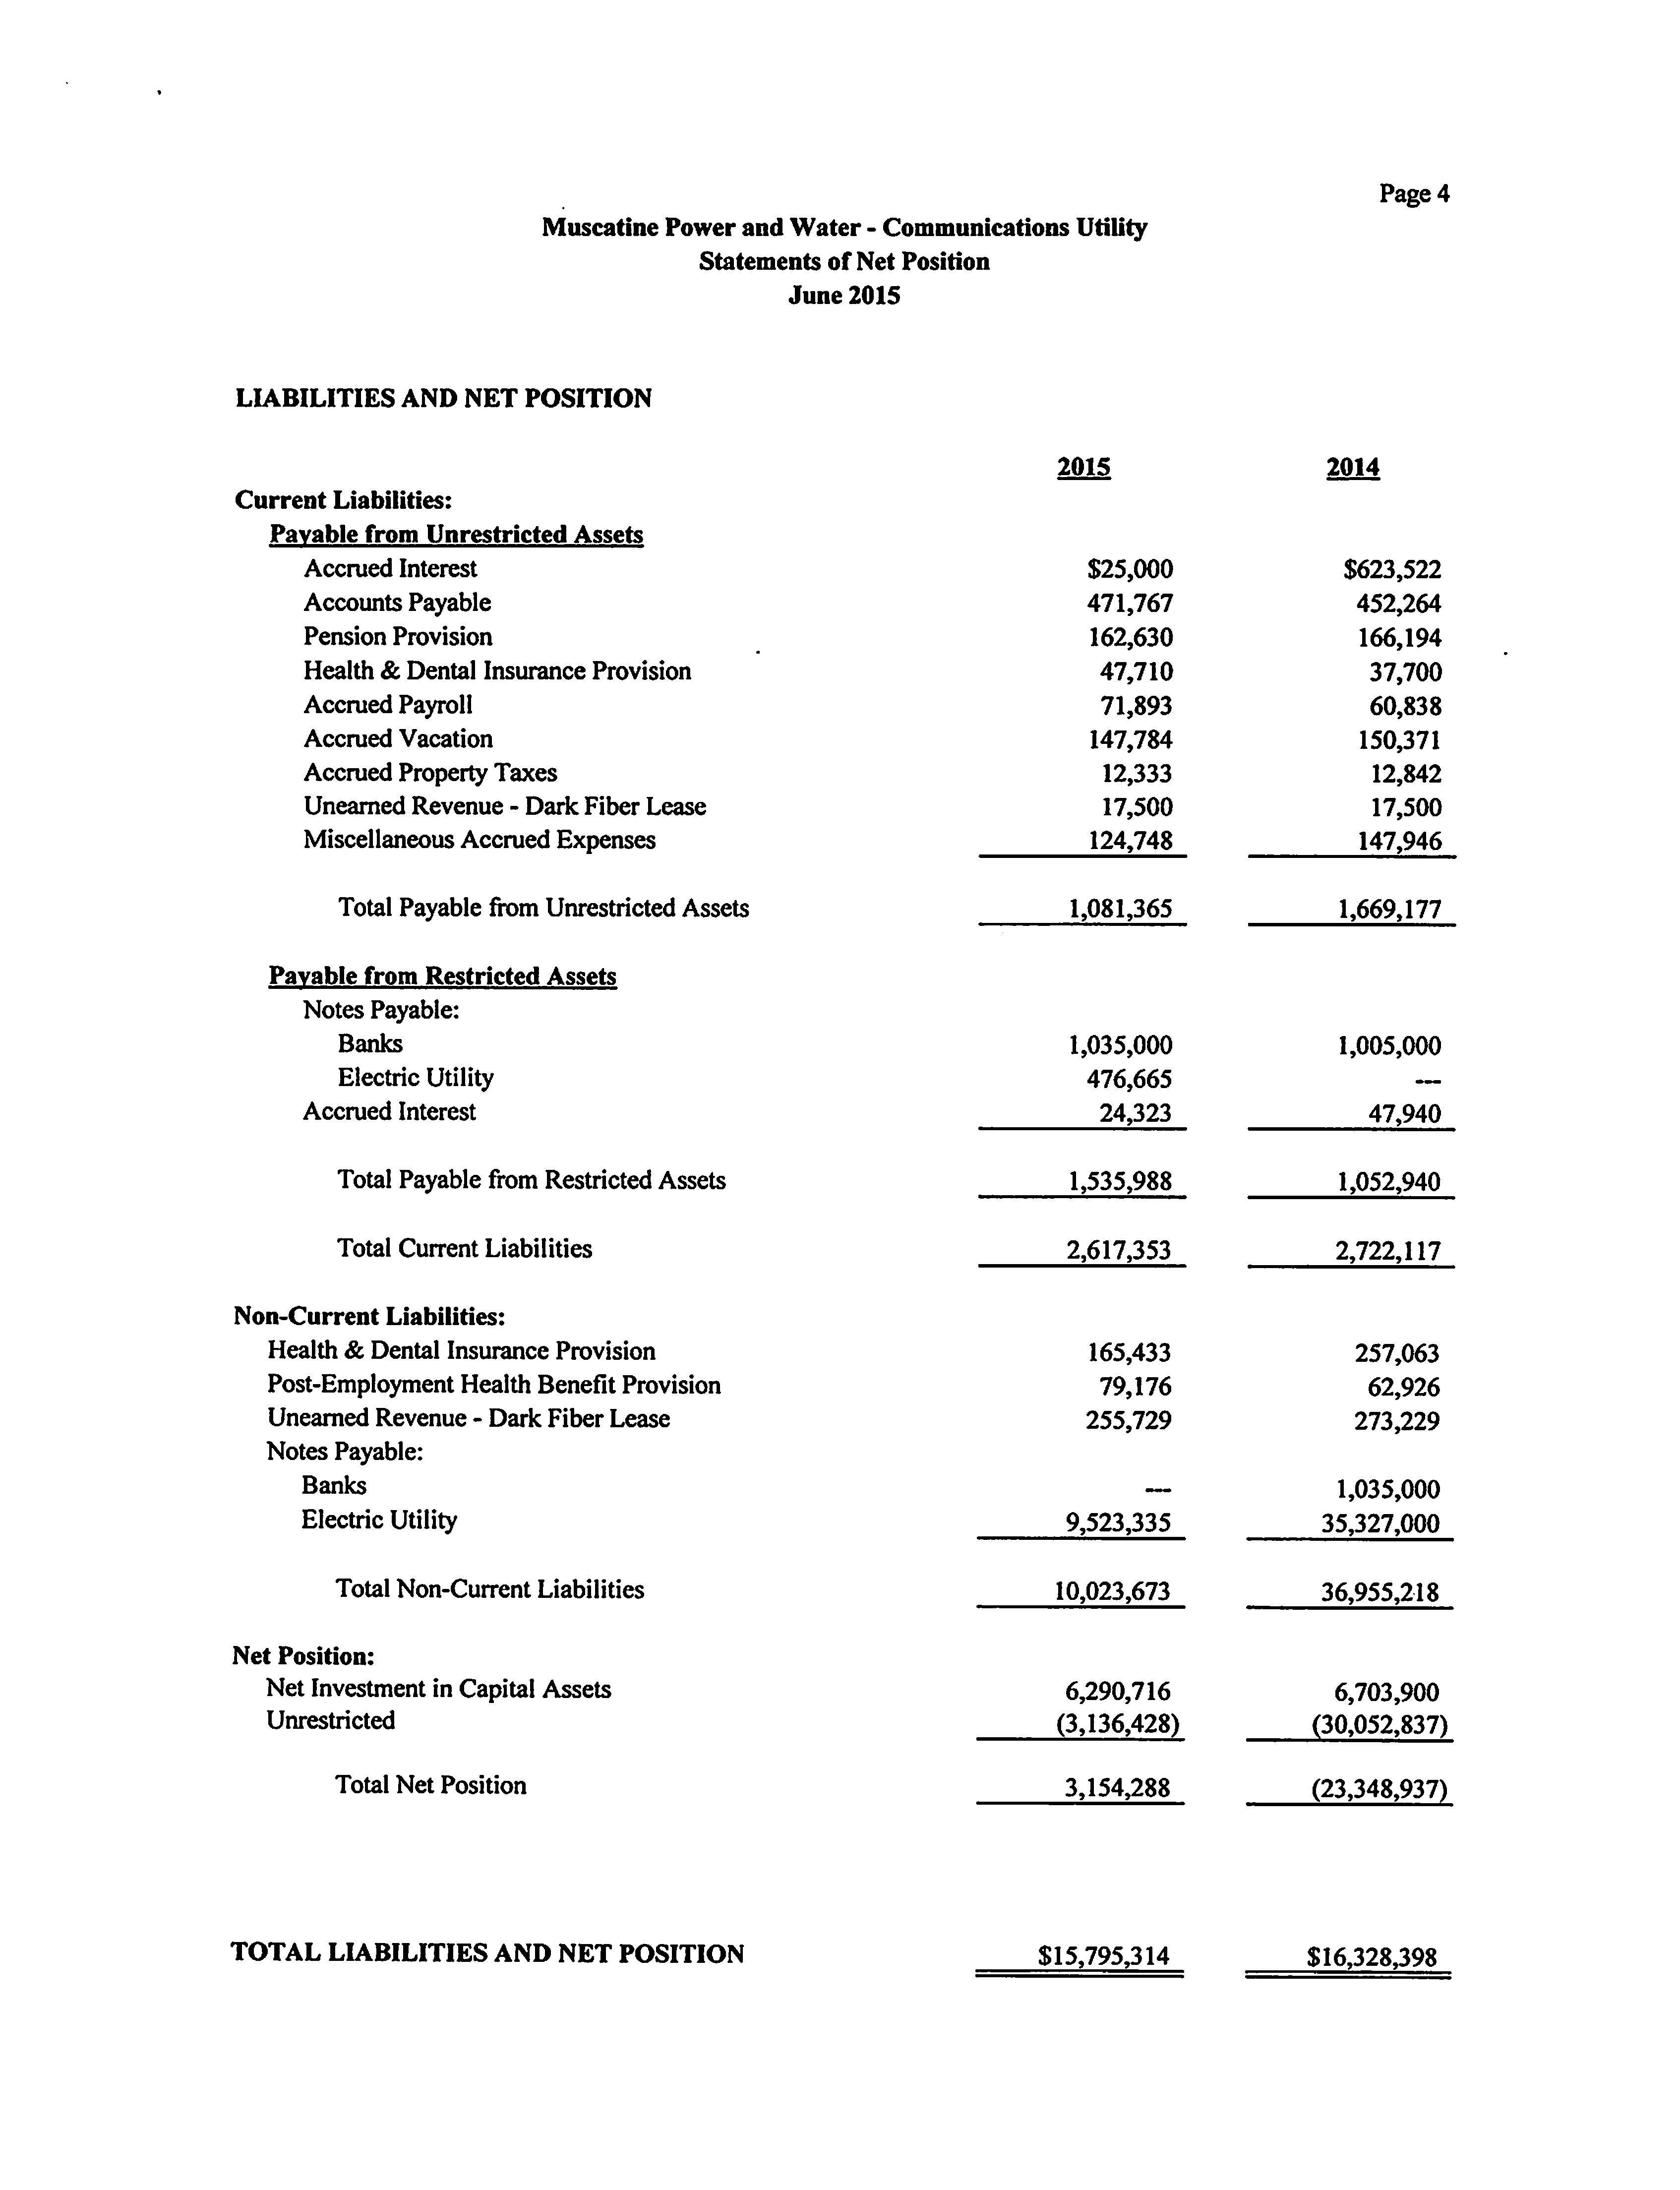
Statements ofNet Position
3-4
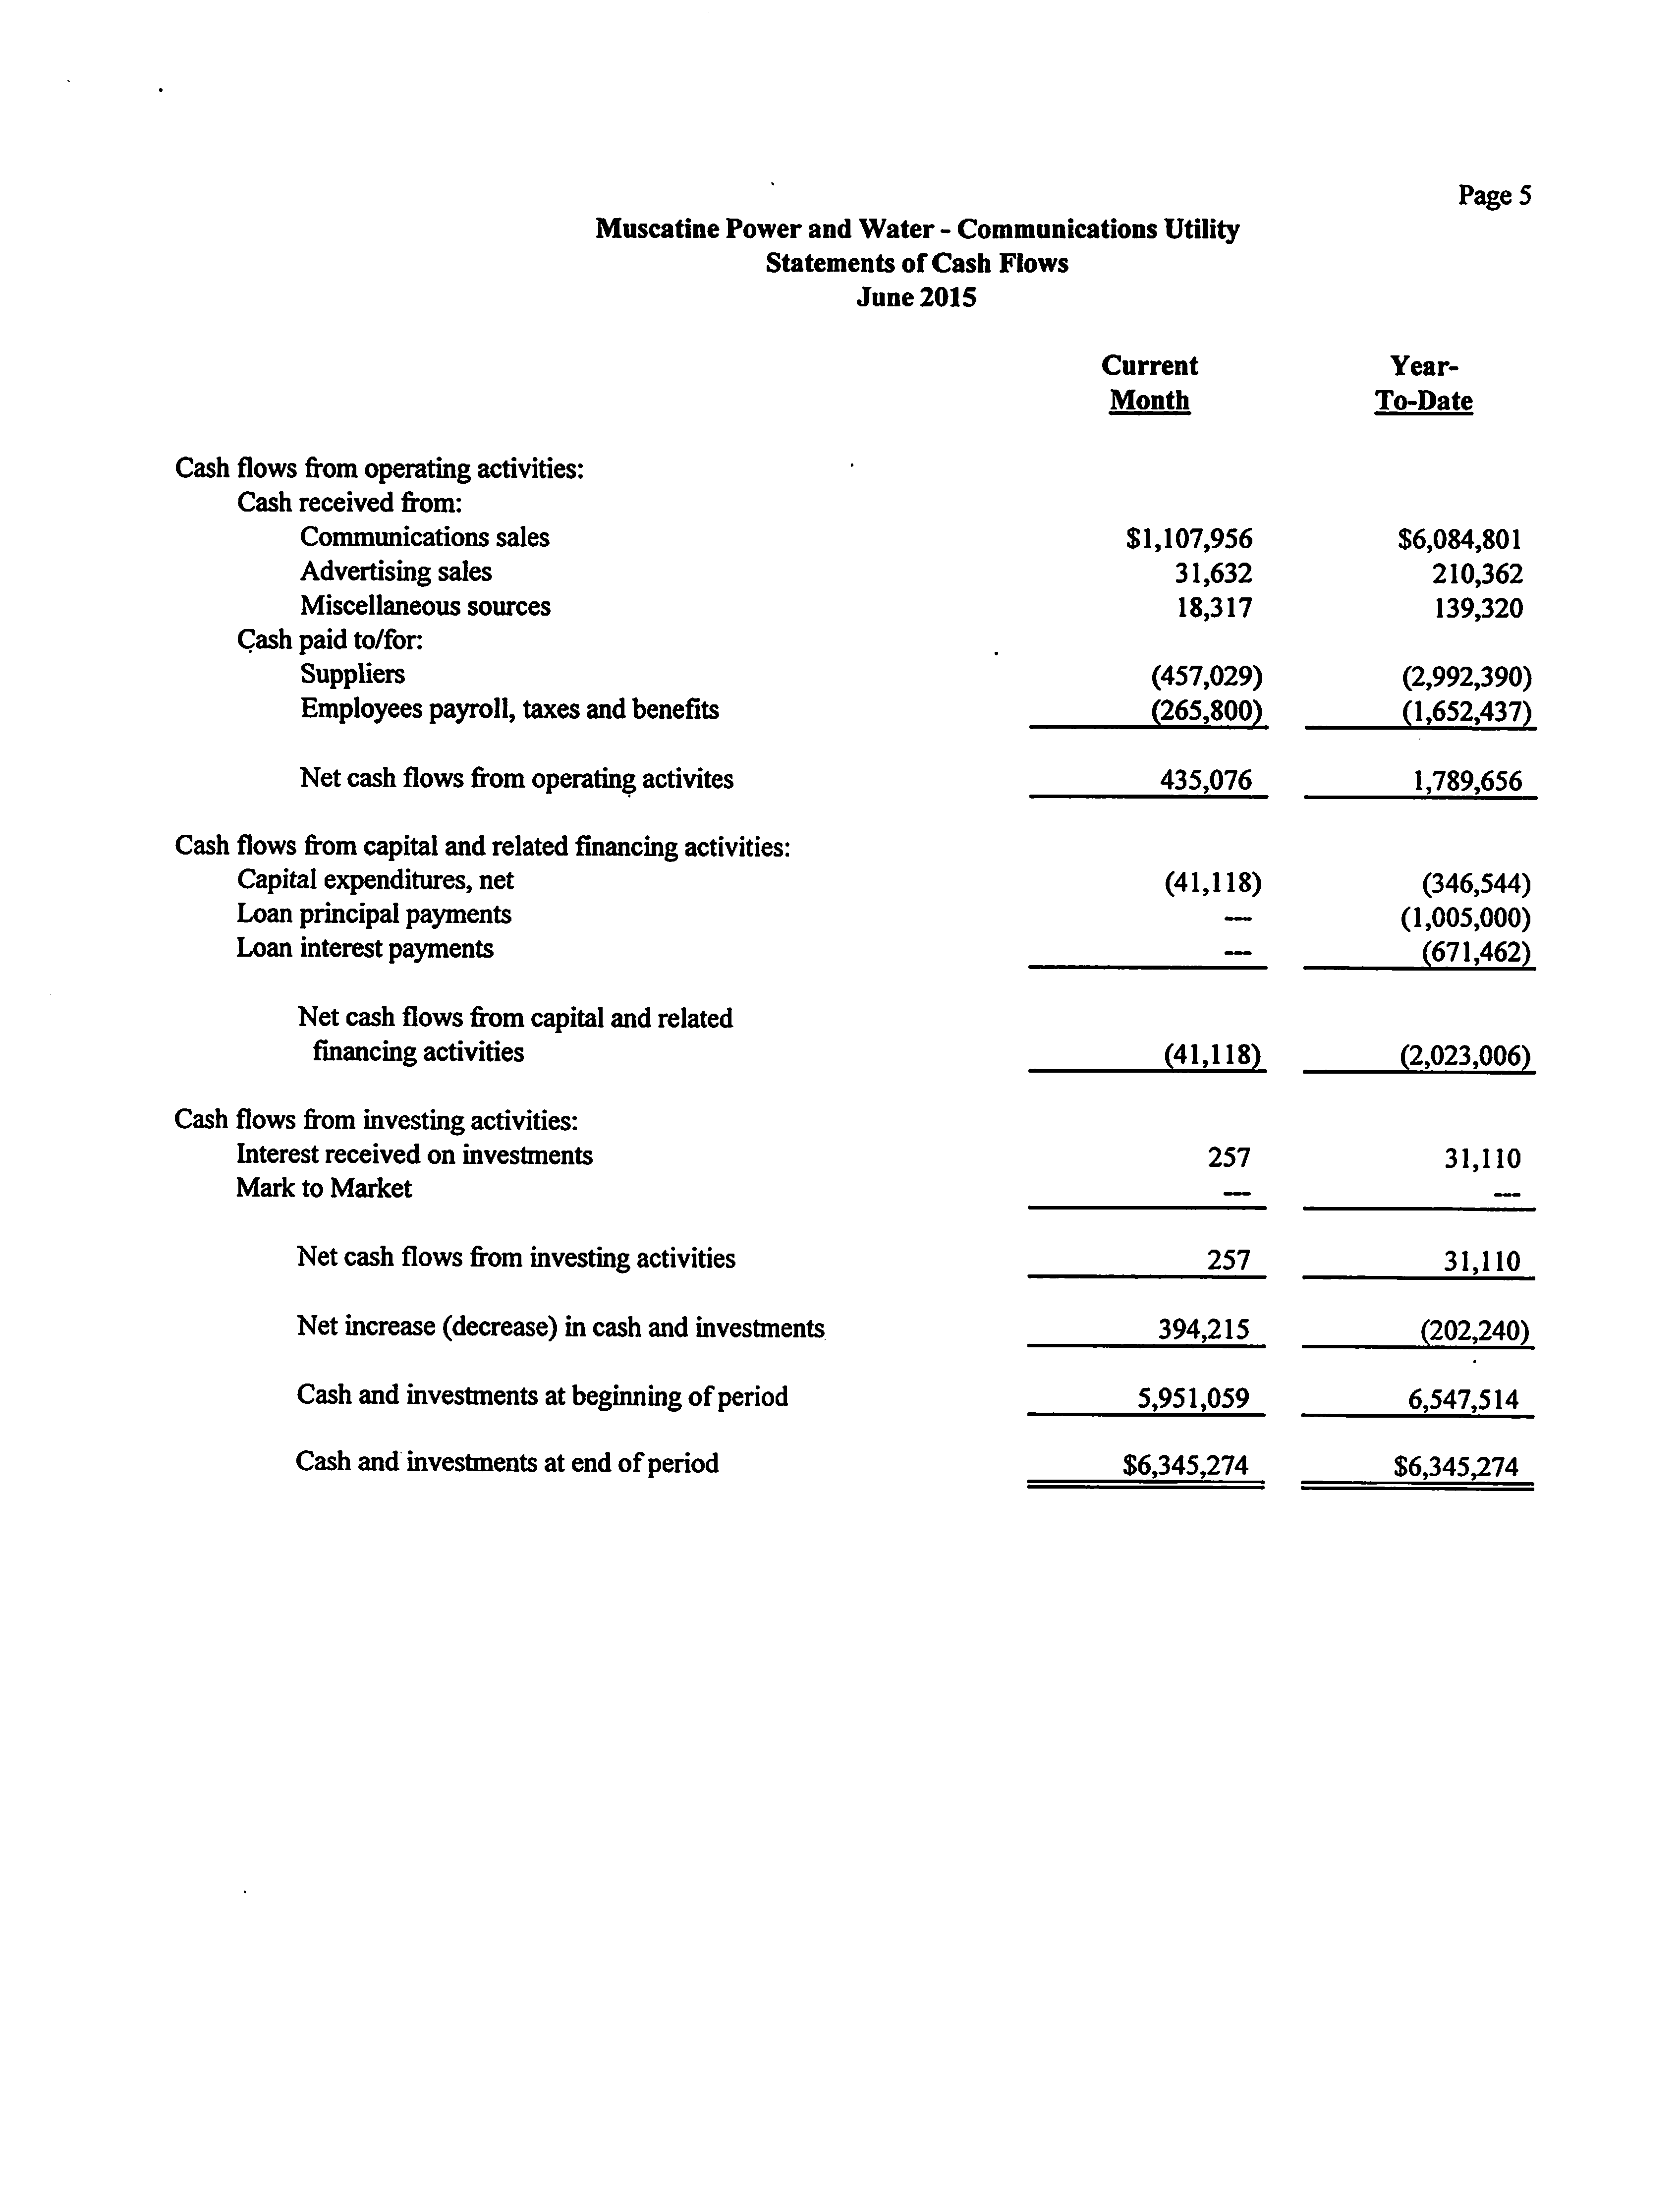
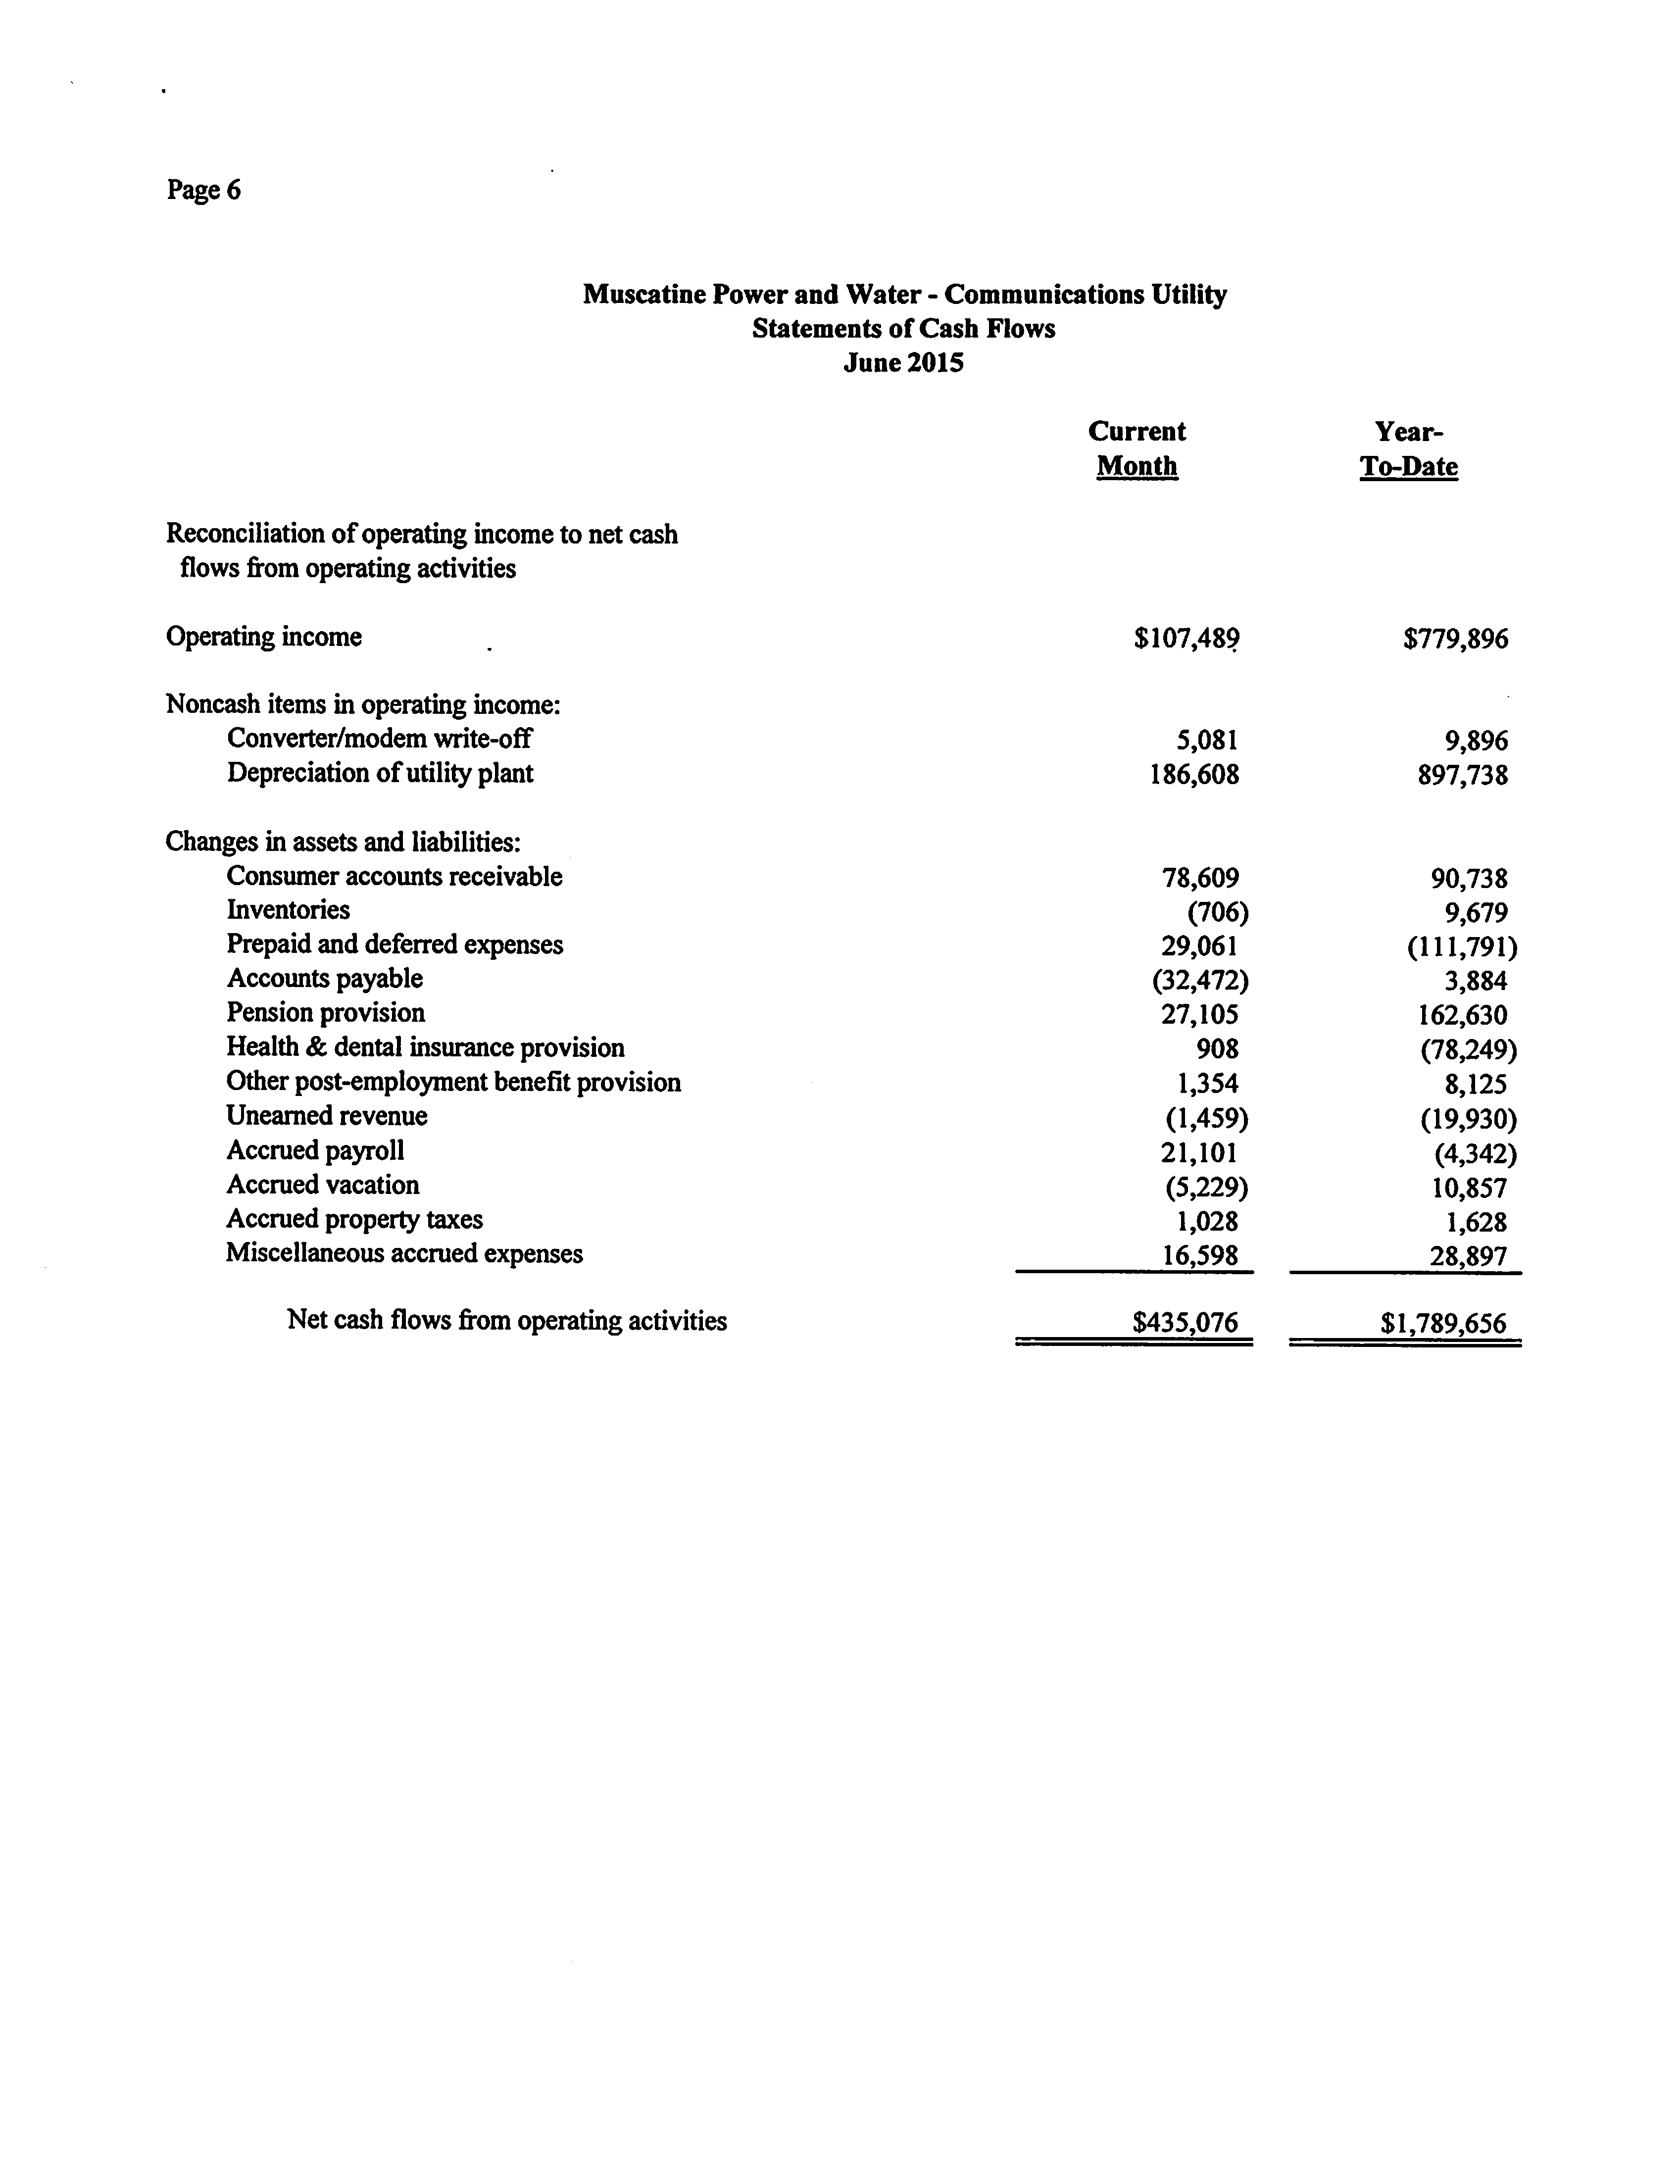
Statements of Cash Flows
5-6
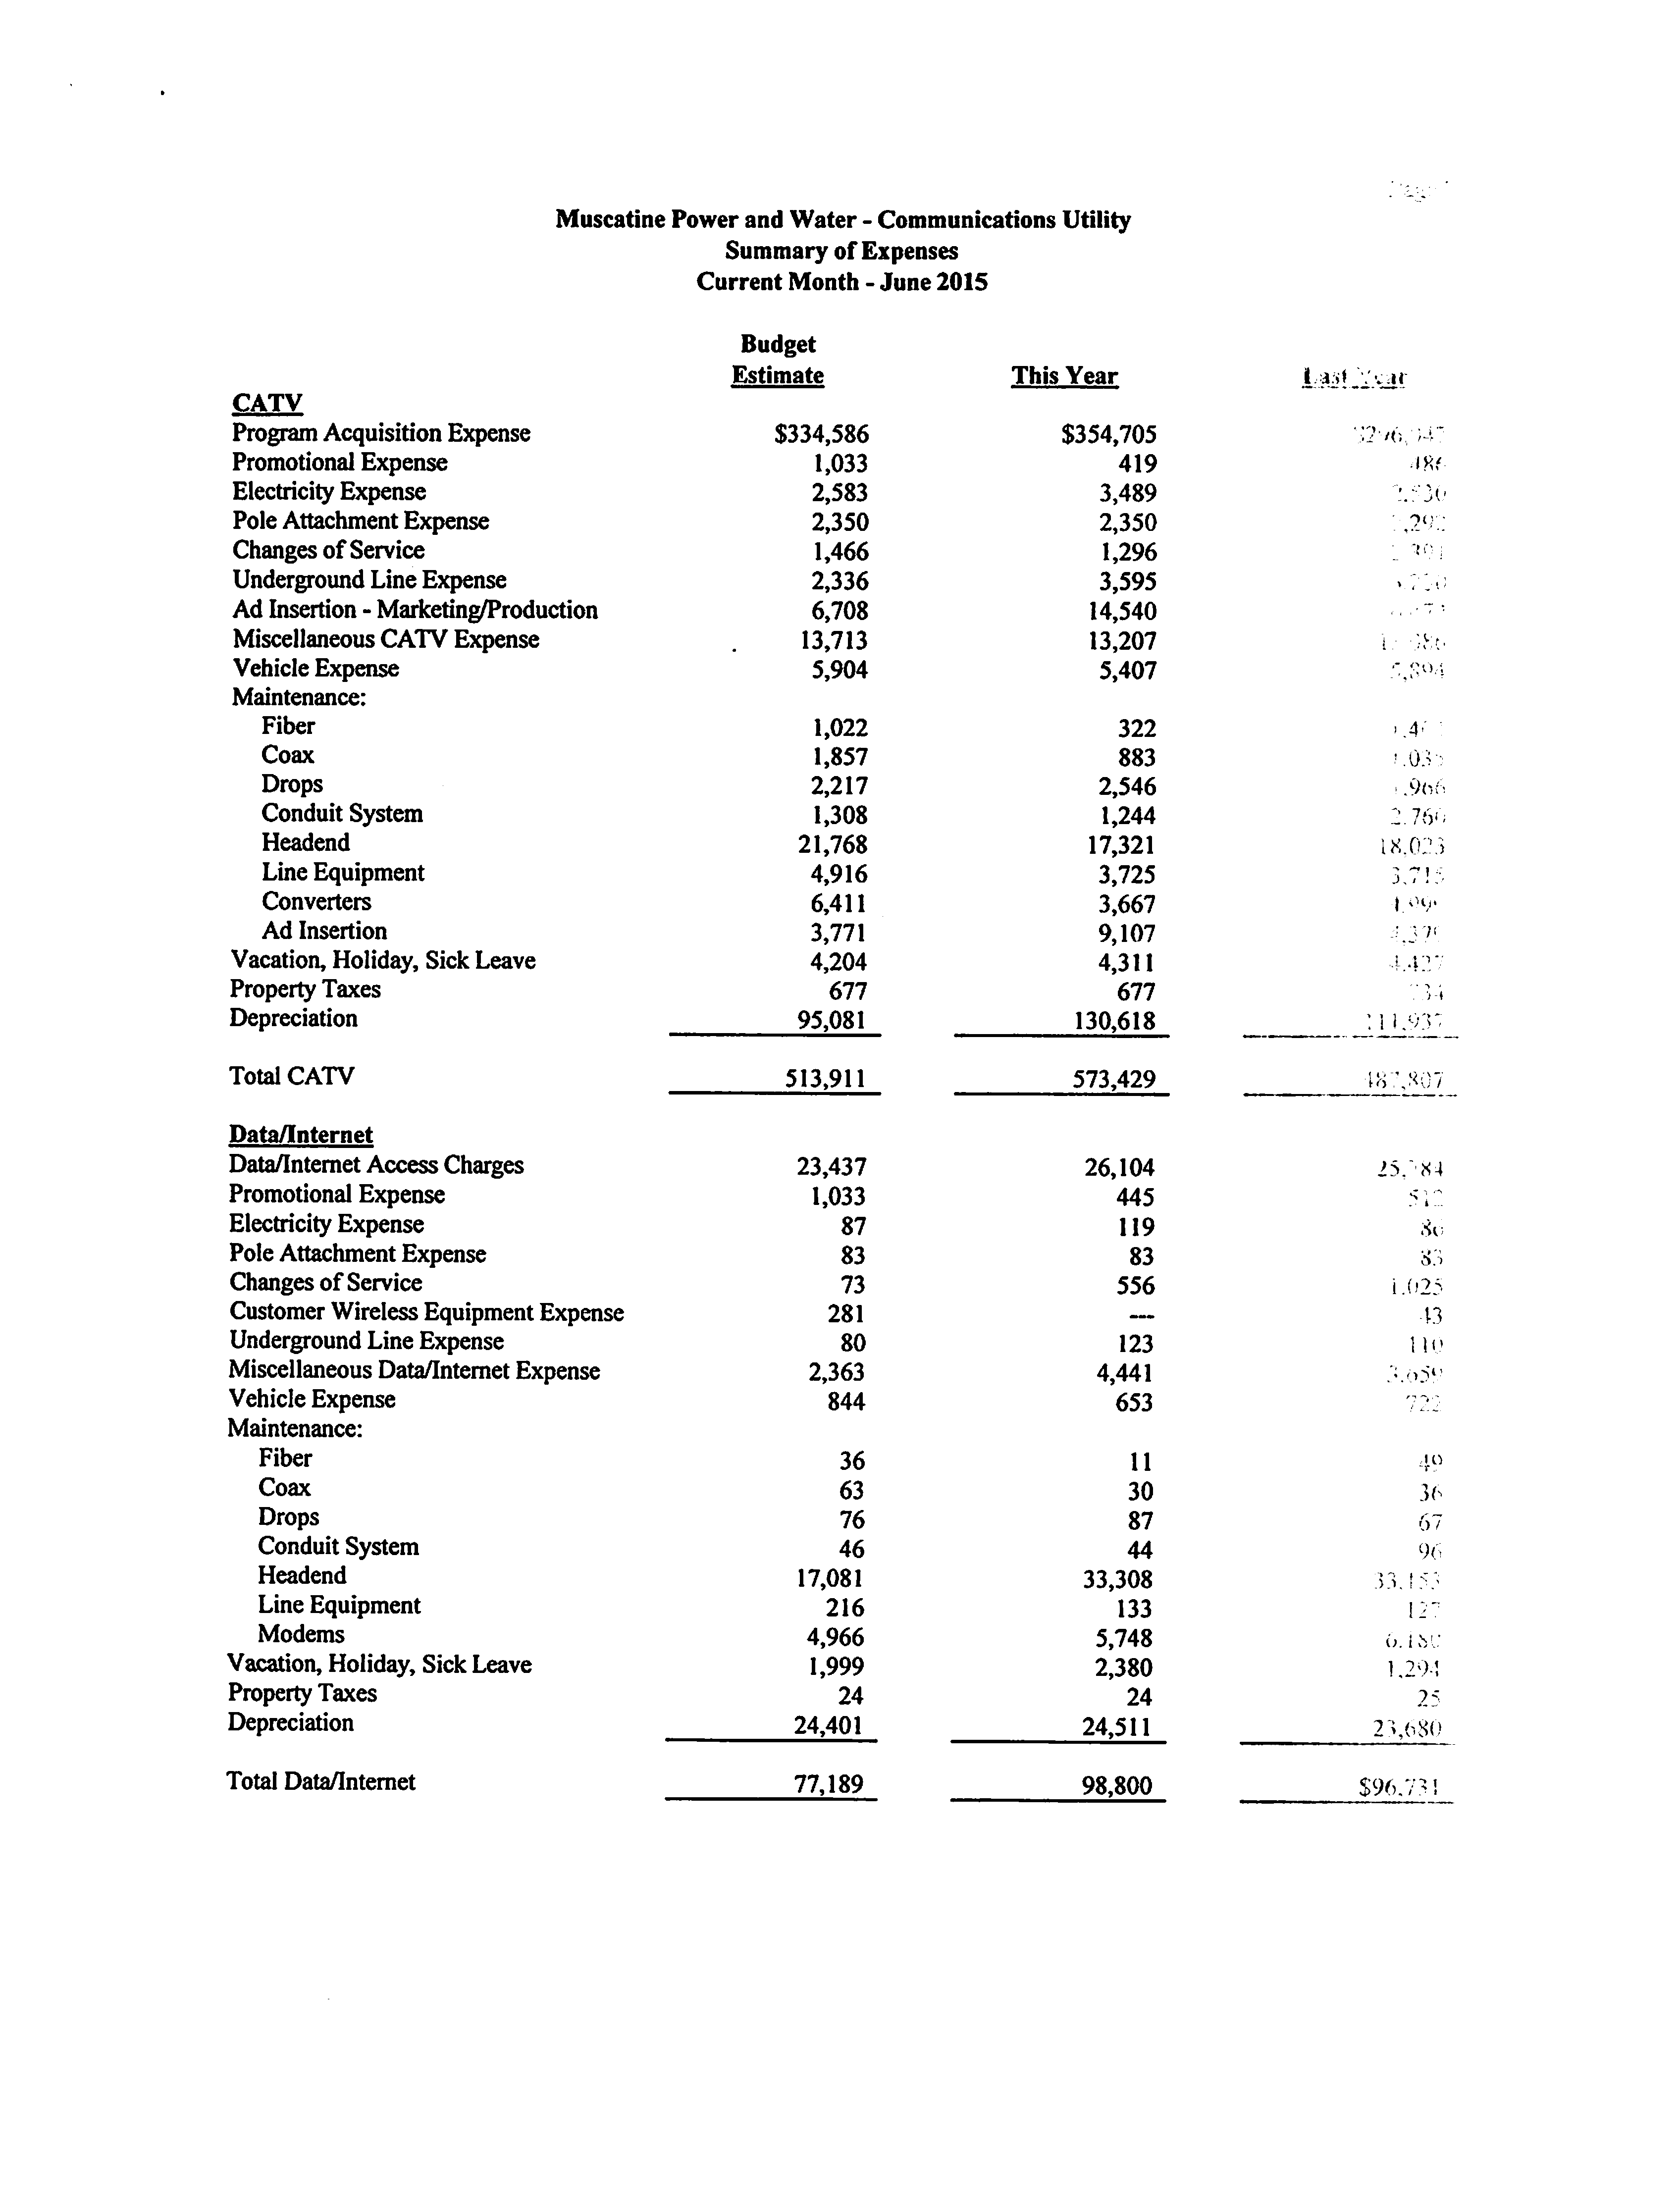
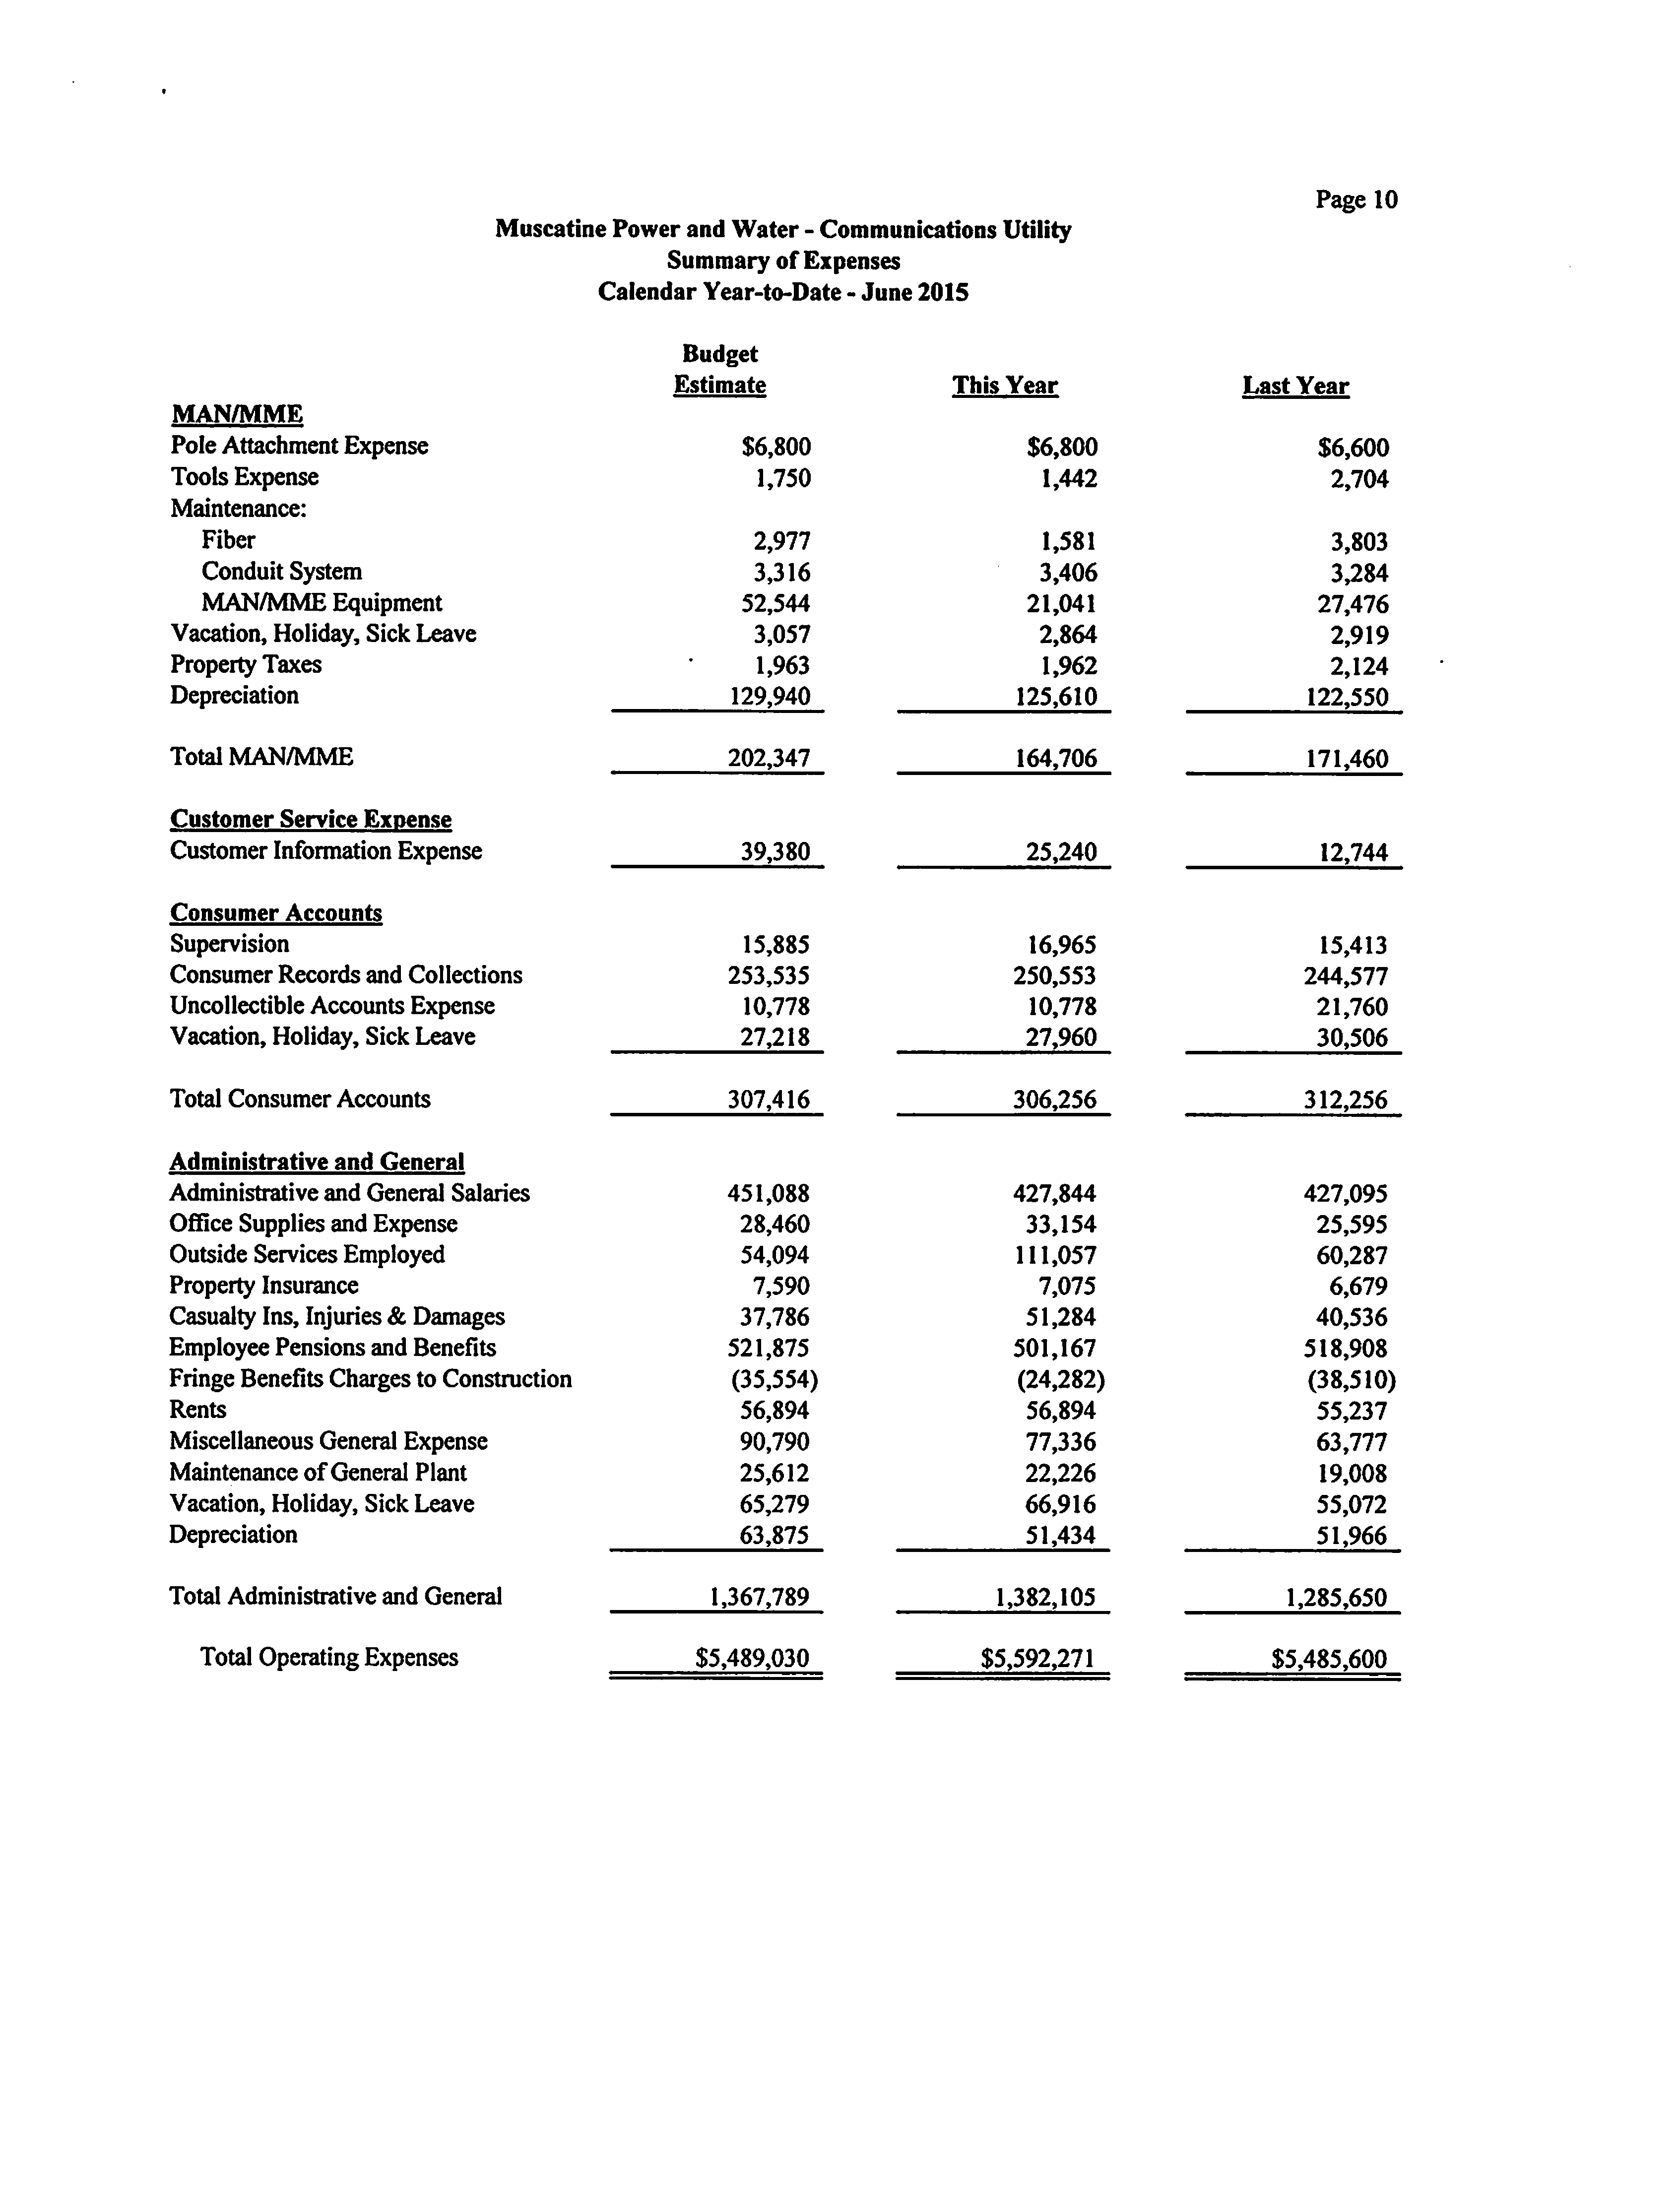
Summary of Expenses
7-10
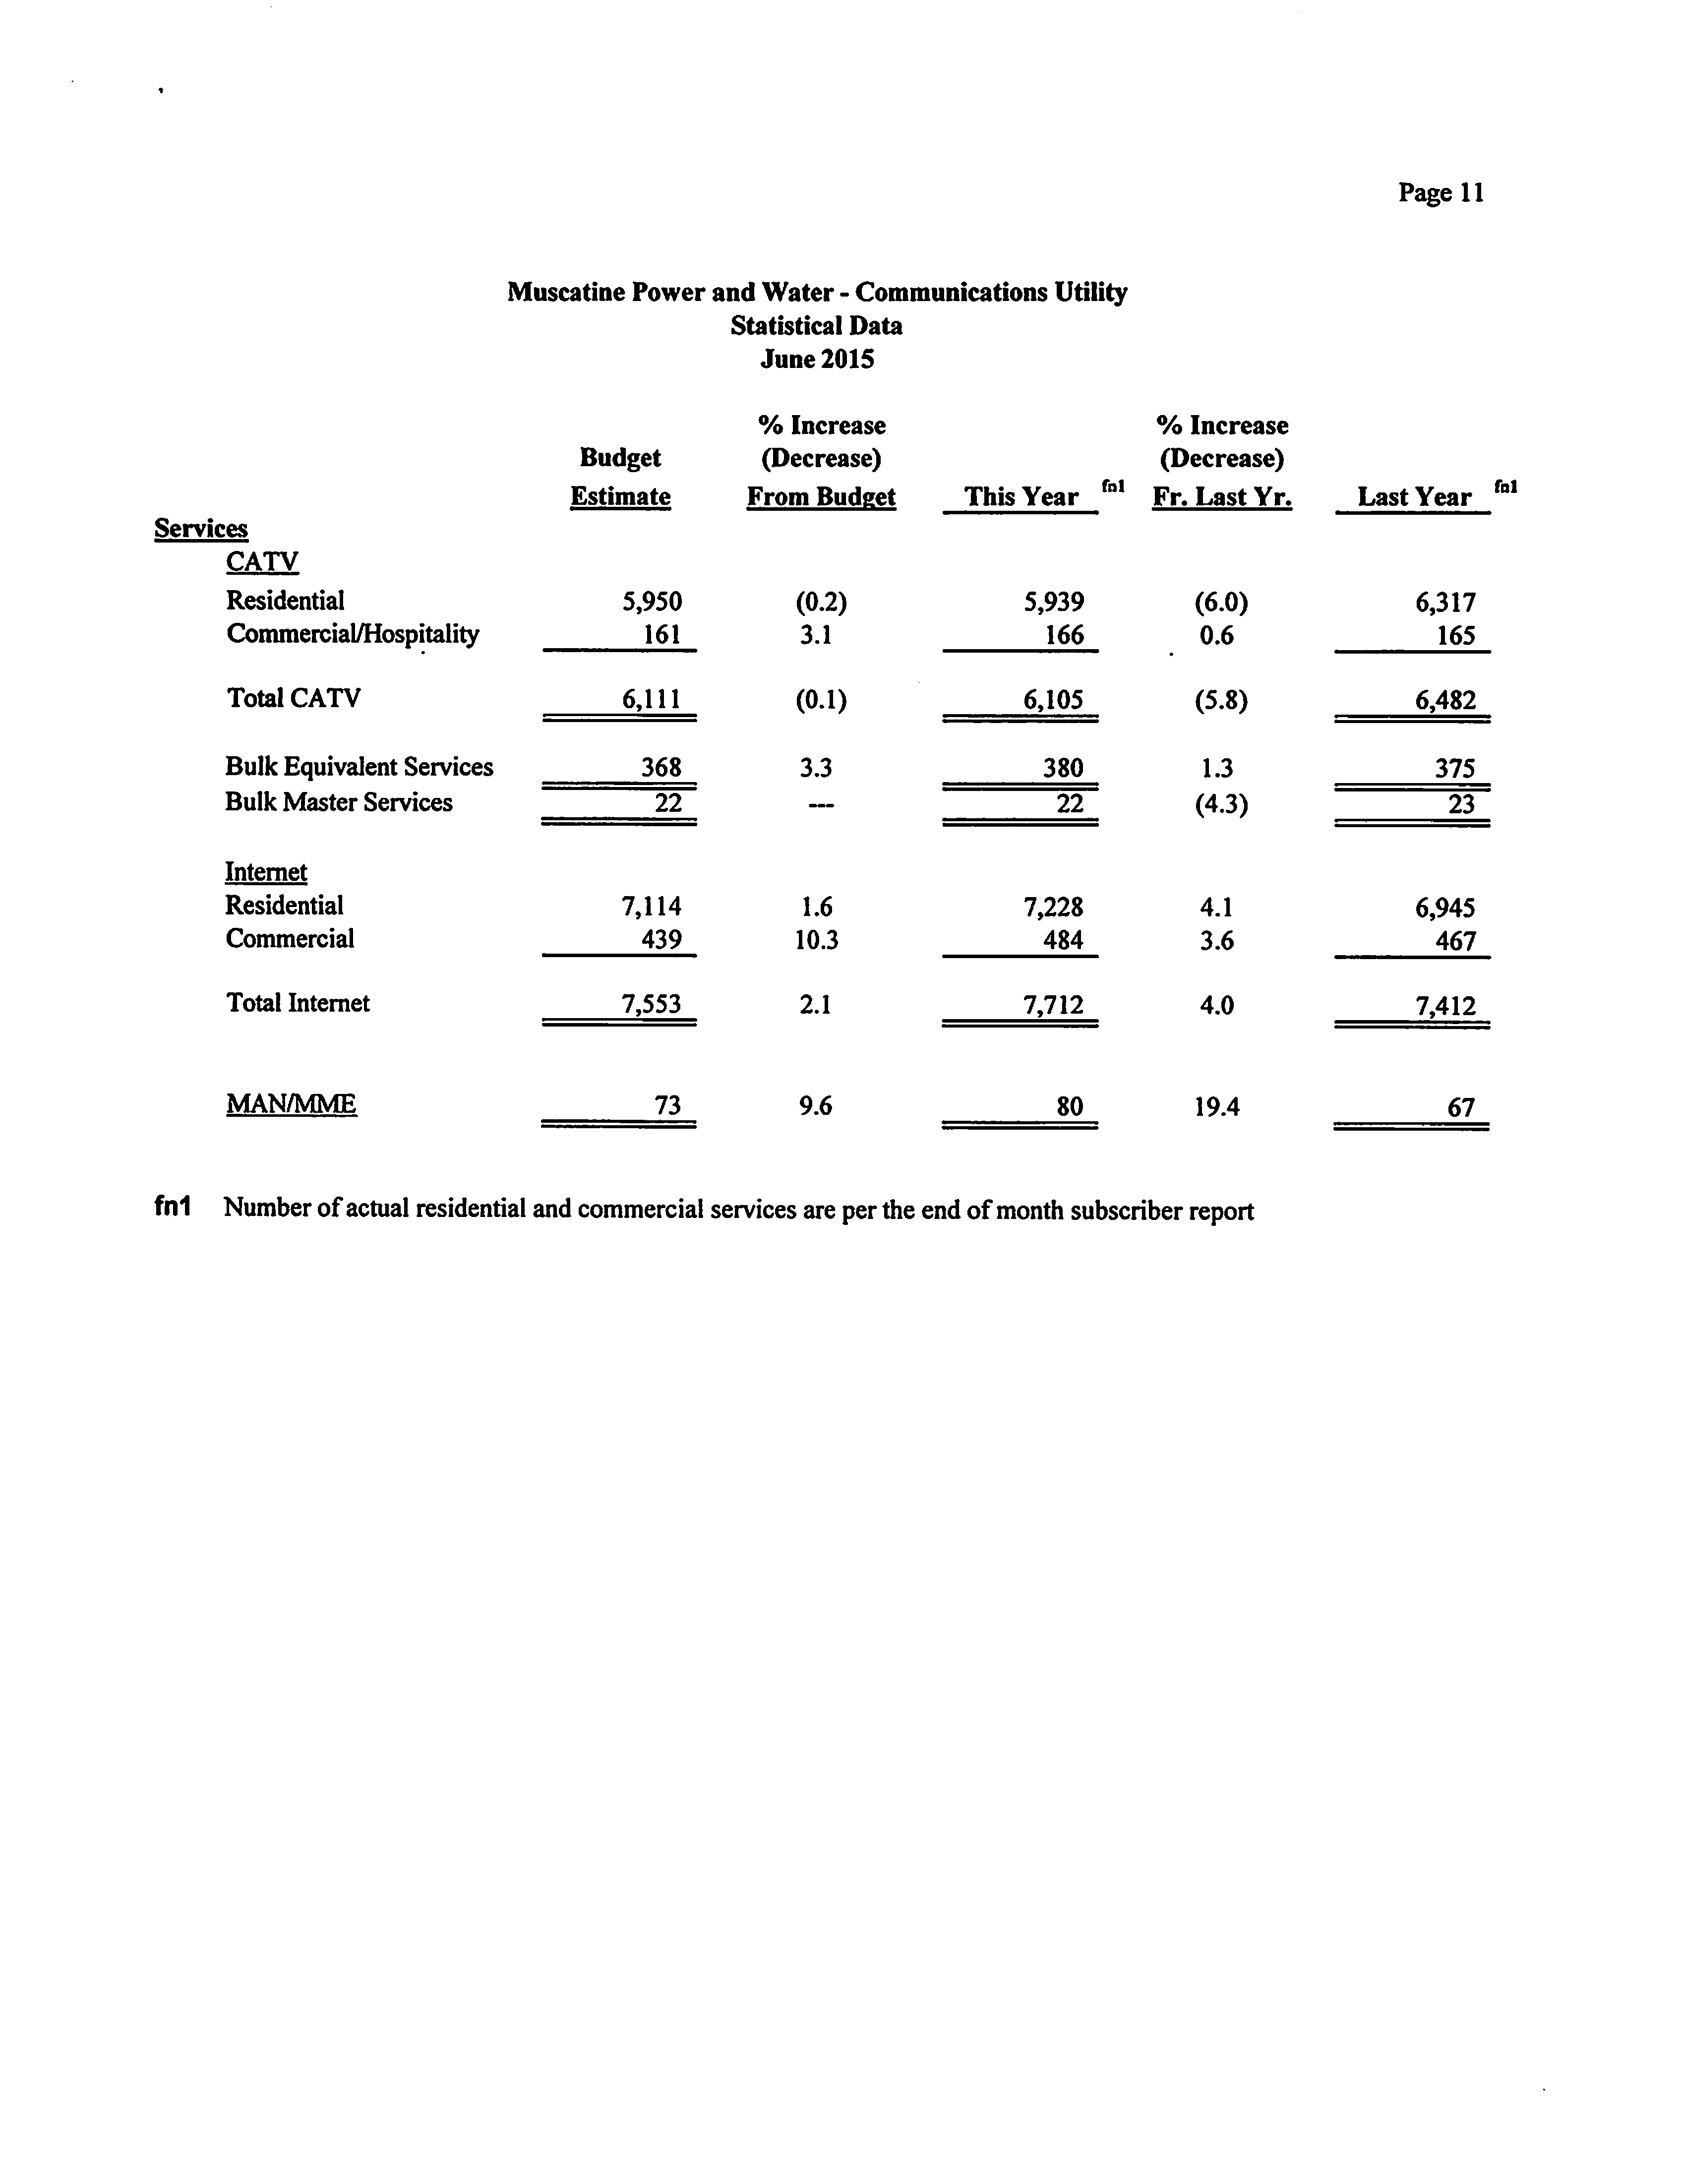
Statistical Data
11
Page 1
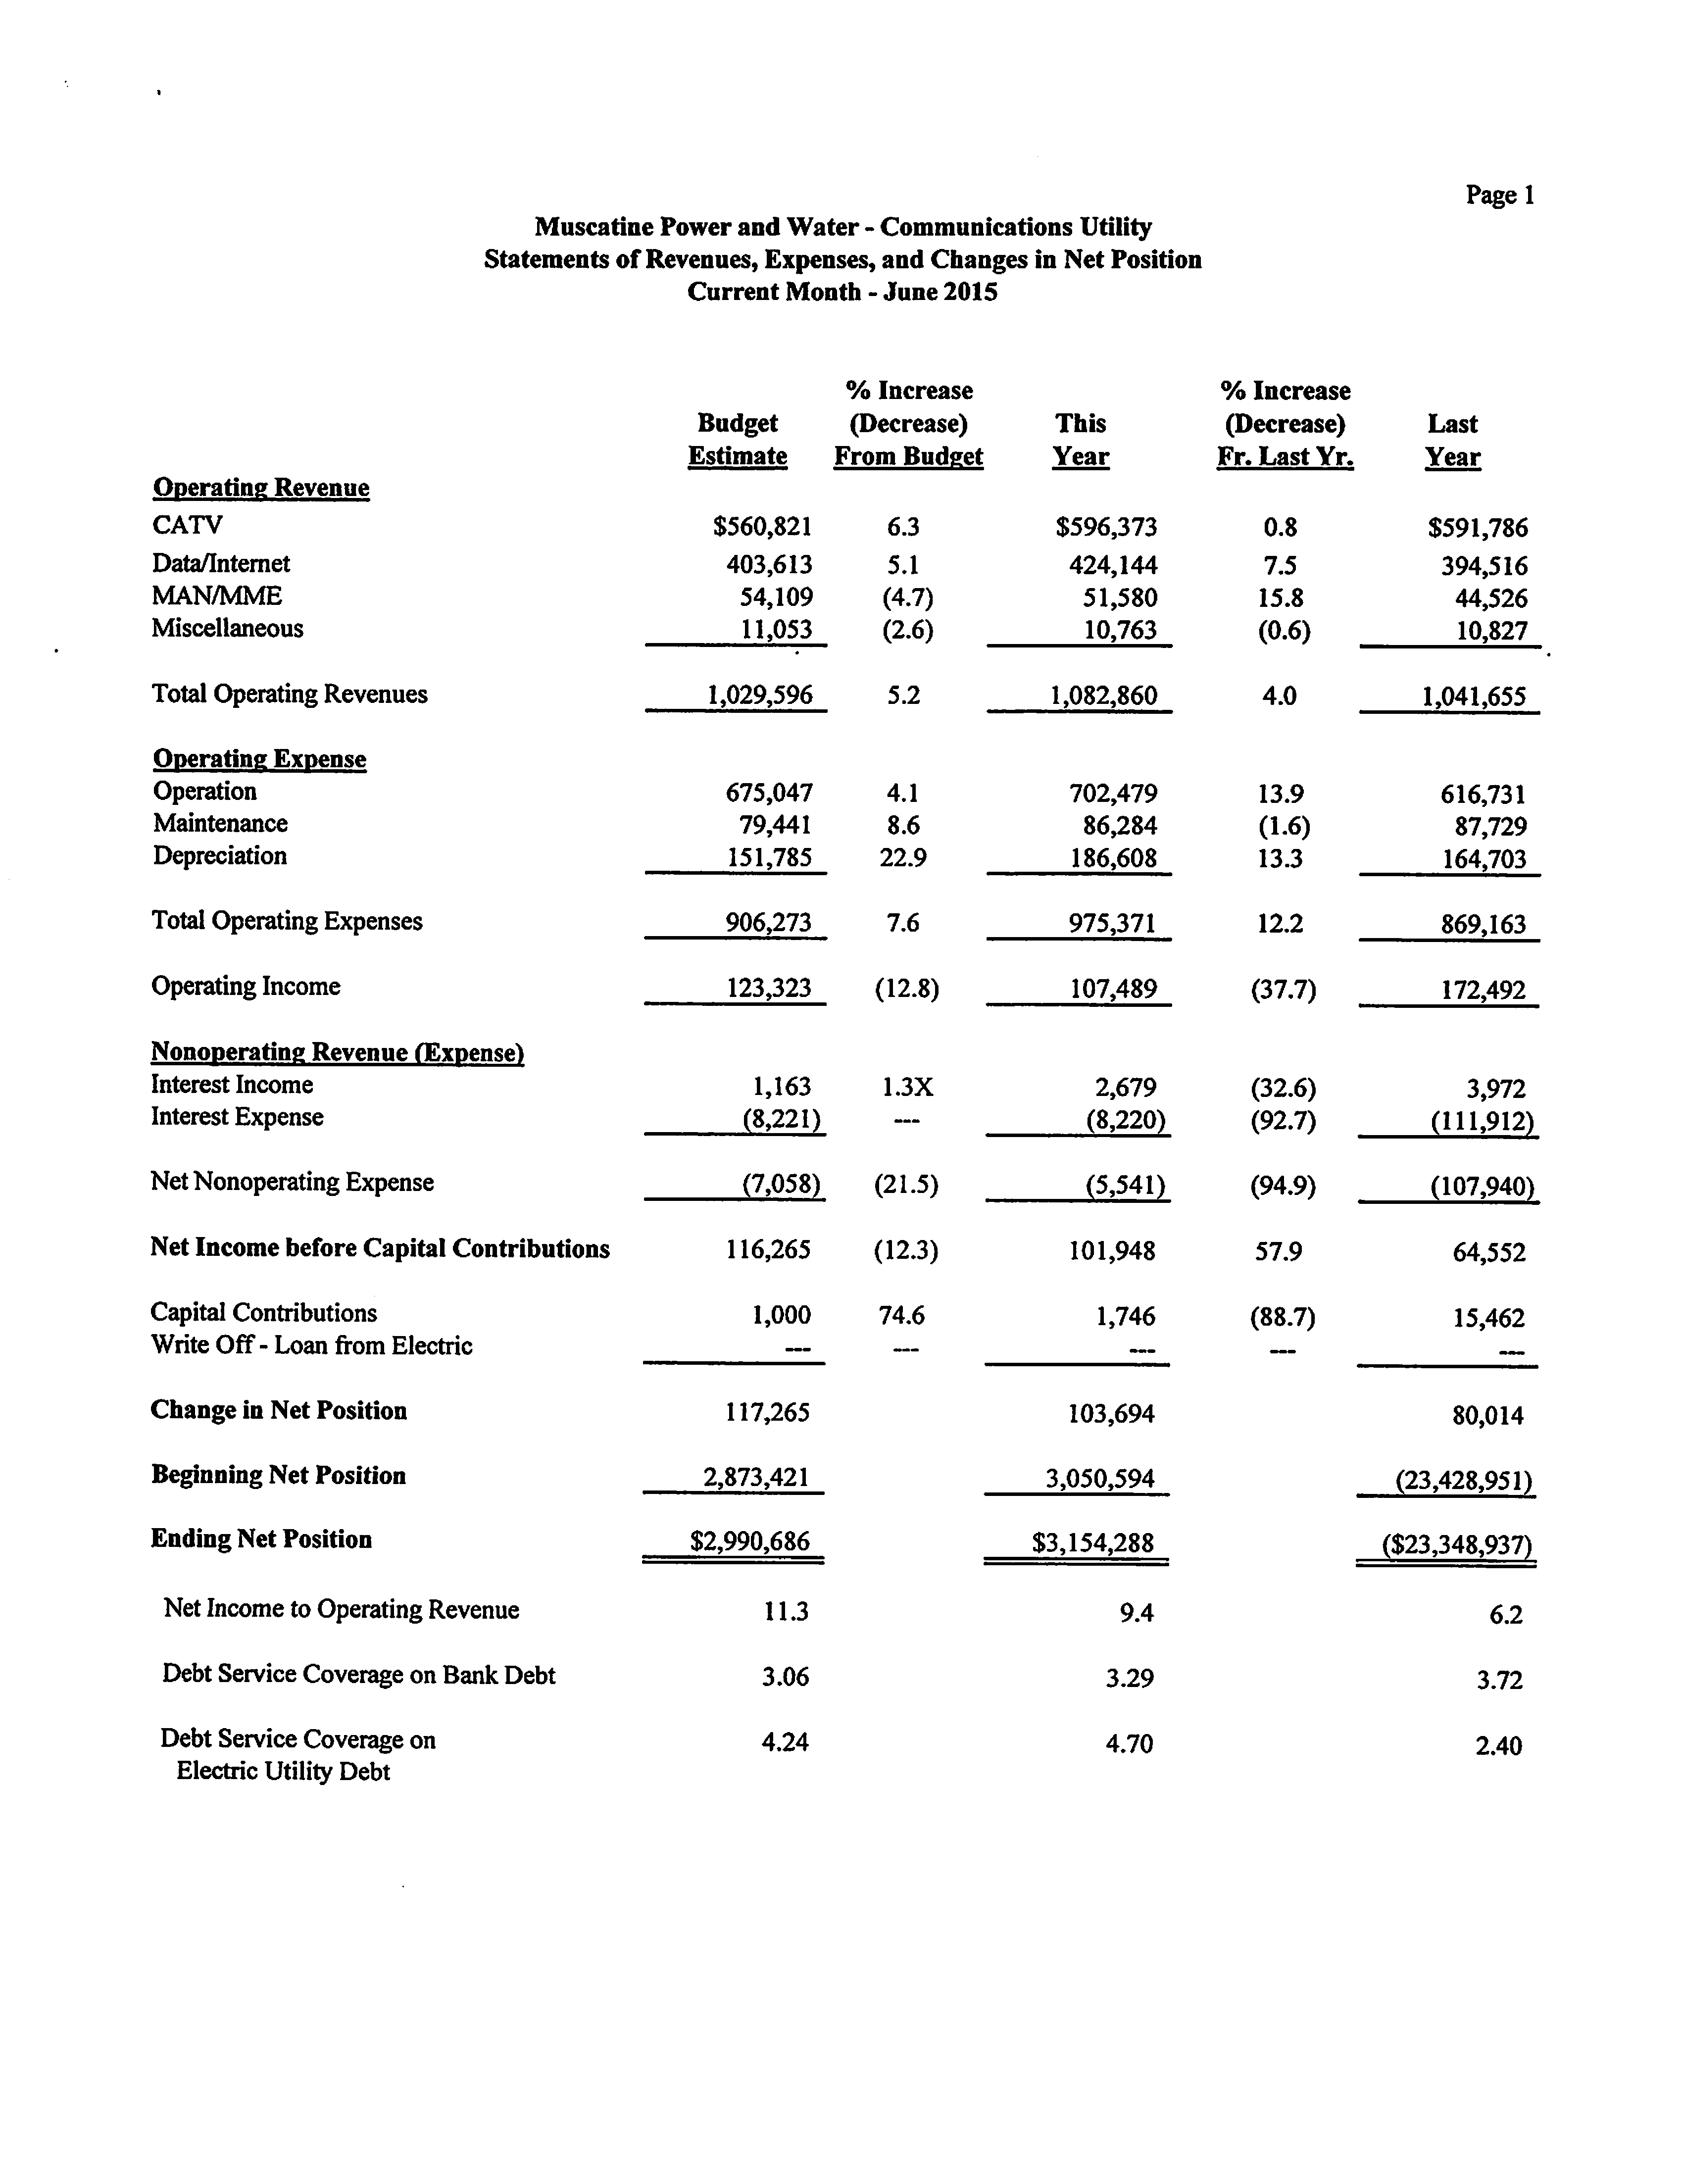
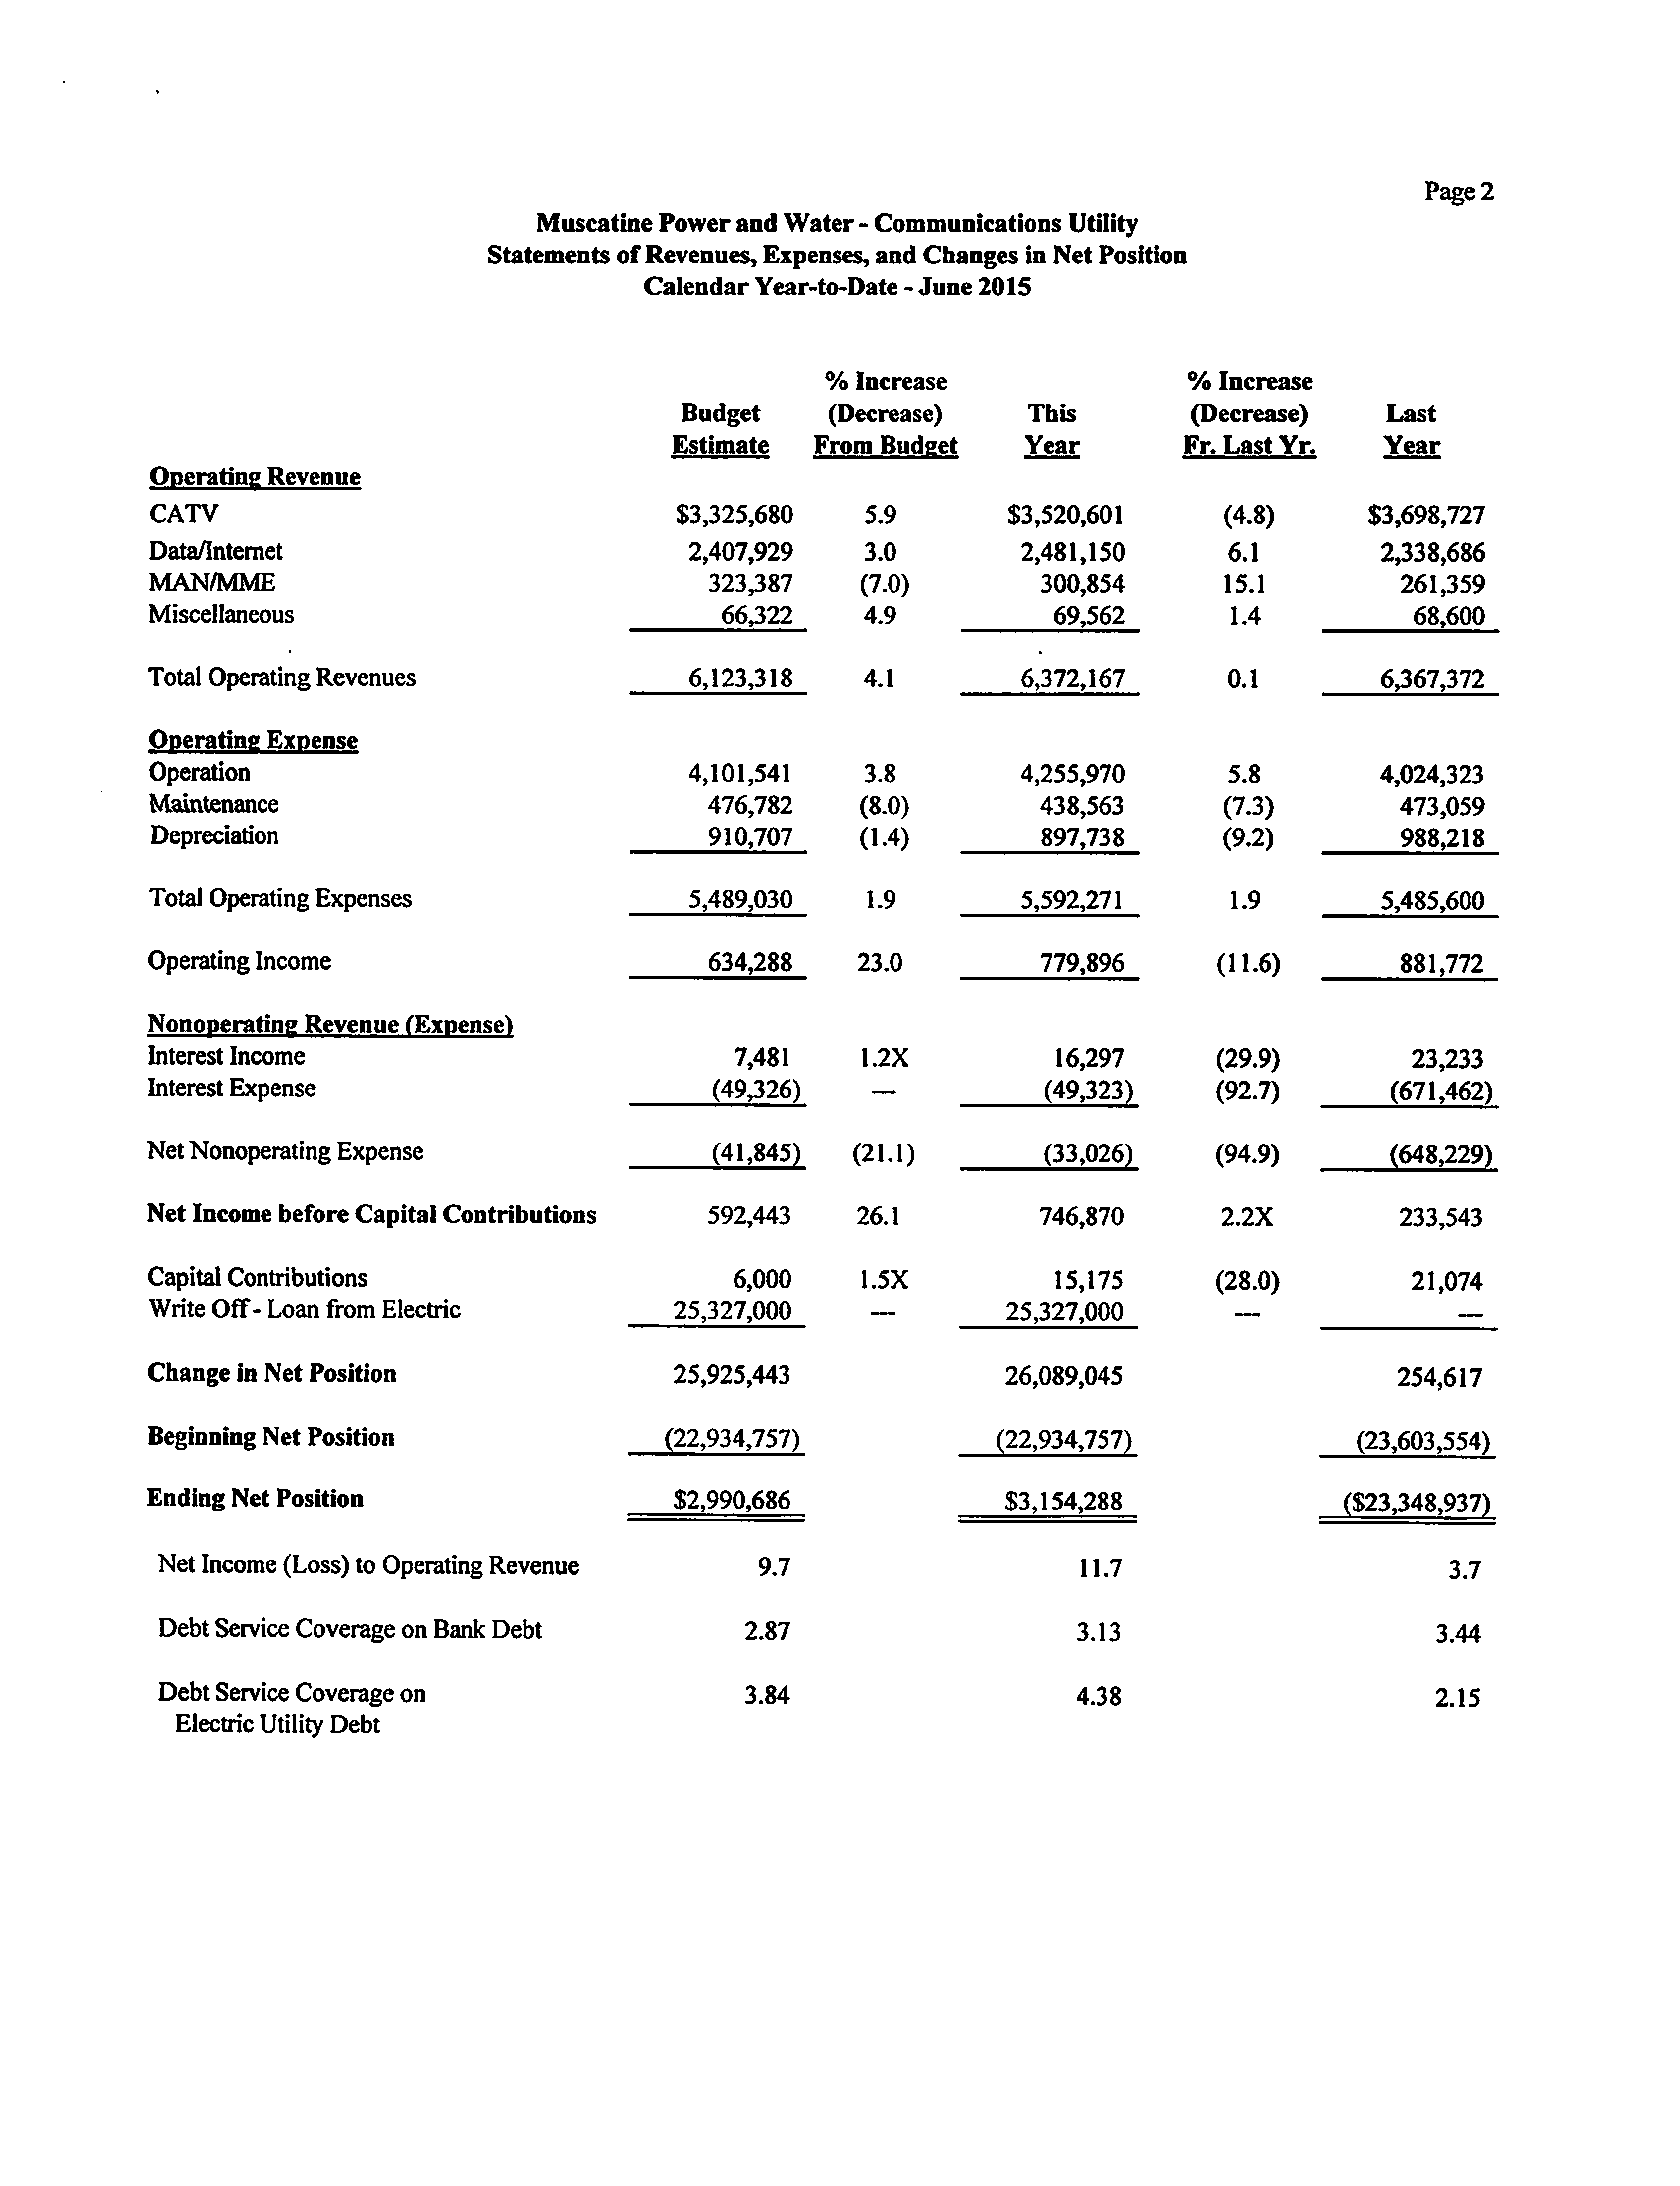
Muscatine Power and Water - Communications Utility
Statements of Revenues, Expenses, and Changes in Net Position
Current Month - June 2015
Operating Revenue
CATV
Data/Internet
MAN/MME
Miscellaneous
Total Operating Revenues
Operating
Expense
Operation
Maintenance
Depreciation
Total Operating Expenses
Operating Income
Nonoperating Revenue
(Expense)
Interest Income
Interest Expense
Net Nonoperating Expense
Net Income before Capital Contributions
Capital Contributions
Write Off- Loan from Electric
Change in Net Position
Beginning Net Position
Ending Net Position
Net Income to Operating Revenue
Debt Service Coverage on Bank Debt
Debt Service Coverage on
Electric Utility Debt
%
Increase
%
Increase
Budget
(Decrease)
This
(Decrease)
Last
Estimate
From Budget
Year
Fr. Last Yr.
Year
$560,821
6.3
$596,373
0.8
$591,786
403,613
5.1
424,144
7.5
394,516
54,109
(4.7)
51,580
15.8
44,526
11,053
(2.6)
10,763
(0.6)
_
10,827
1,029,596
5.2
1,082,860
4.0
1,041,655
675,047
4.1
702,479
13.9
616,731
79,441
8.6
86,284
(1.6)
87,729
151,785
22.9
186,608
13.3
164,703
906,273
7.6
975,371
12.2
869,163
123,323
(12.8)
107,489
(37.7)
172,492
1,163
1.3X
2,679
(32.6)
3,972
(8,221)
—
(8,220)
(92.7)
(111,912)
(7,058)
(21.5)
(5,541)
(94.9)
(107,940)
116,265
(12.3)
101,948
57.9
64,552
1,000
74.6
1,746
(88.7)
15,462
117,265
103,694
80,014
2,873,421
3,050,594
(23,428,951)
$2,990,686
$3,154,288
($23,348,937)
11.3
9.4
6.2
3.06
3.29
3.72
4.24
4.70
2.40
Back to top