Muscatine Power and Water
Electric Utility
Statement of Revenues, Expenses and Changes in Net Position
May 2015
Muscatine Power and Water
Electric Utility
Table of Contents
Page
Classification of Electric Energy Distribution
1-2
Statements of Revenues, Expenses, and Changes in Net Position
3-4
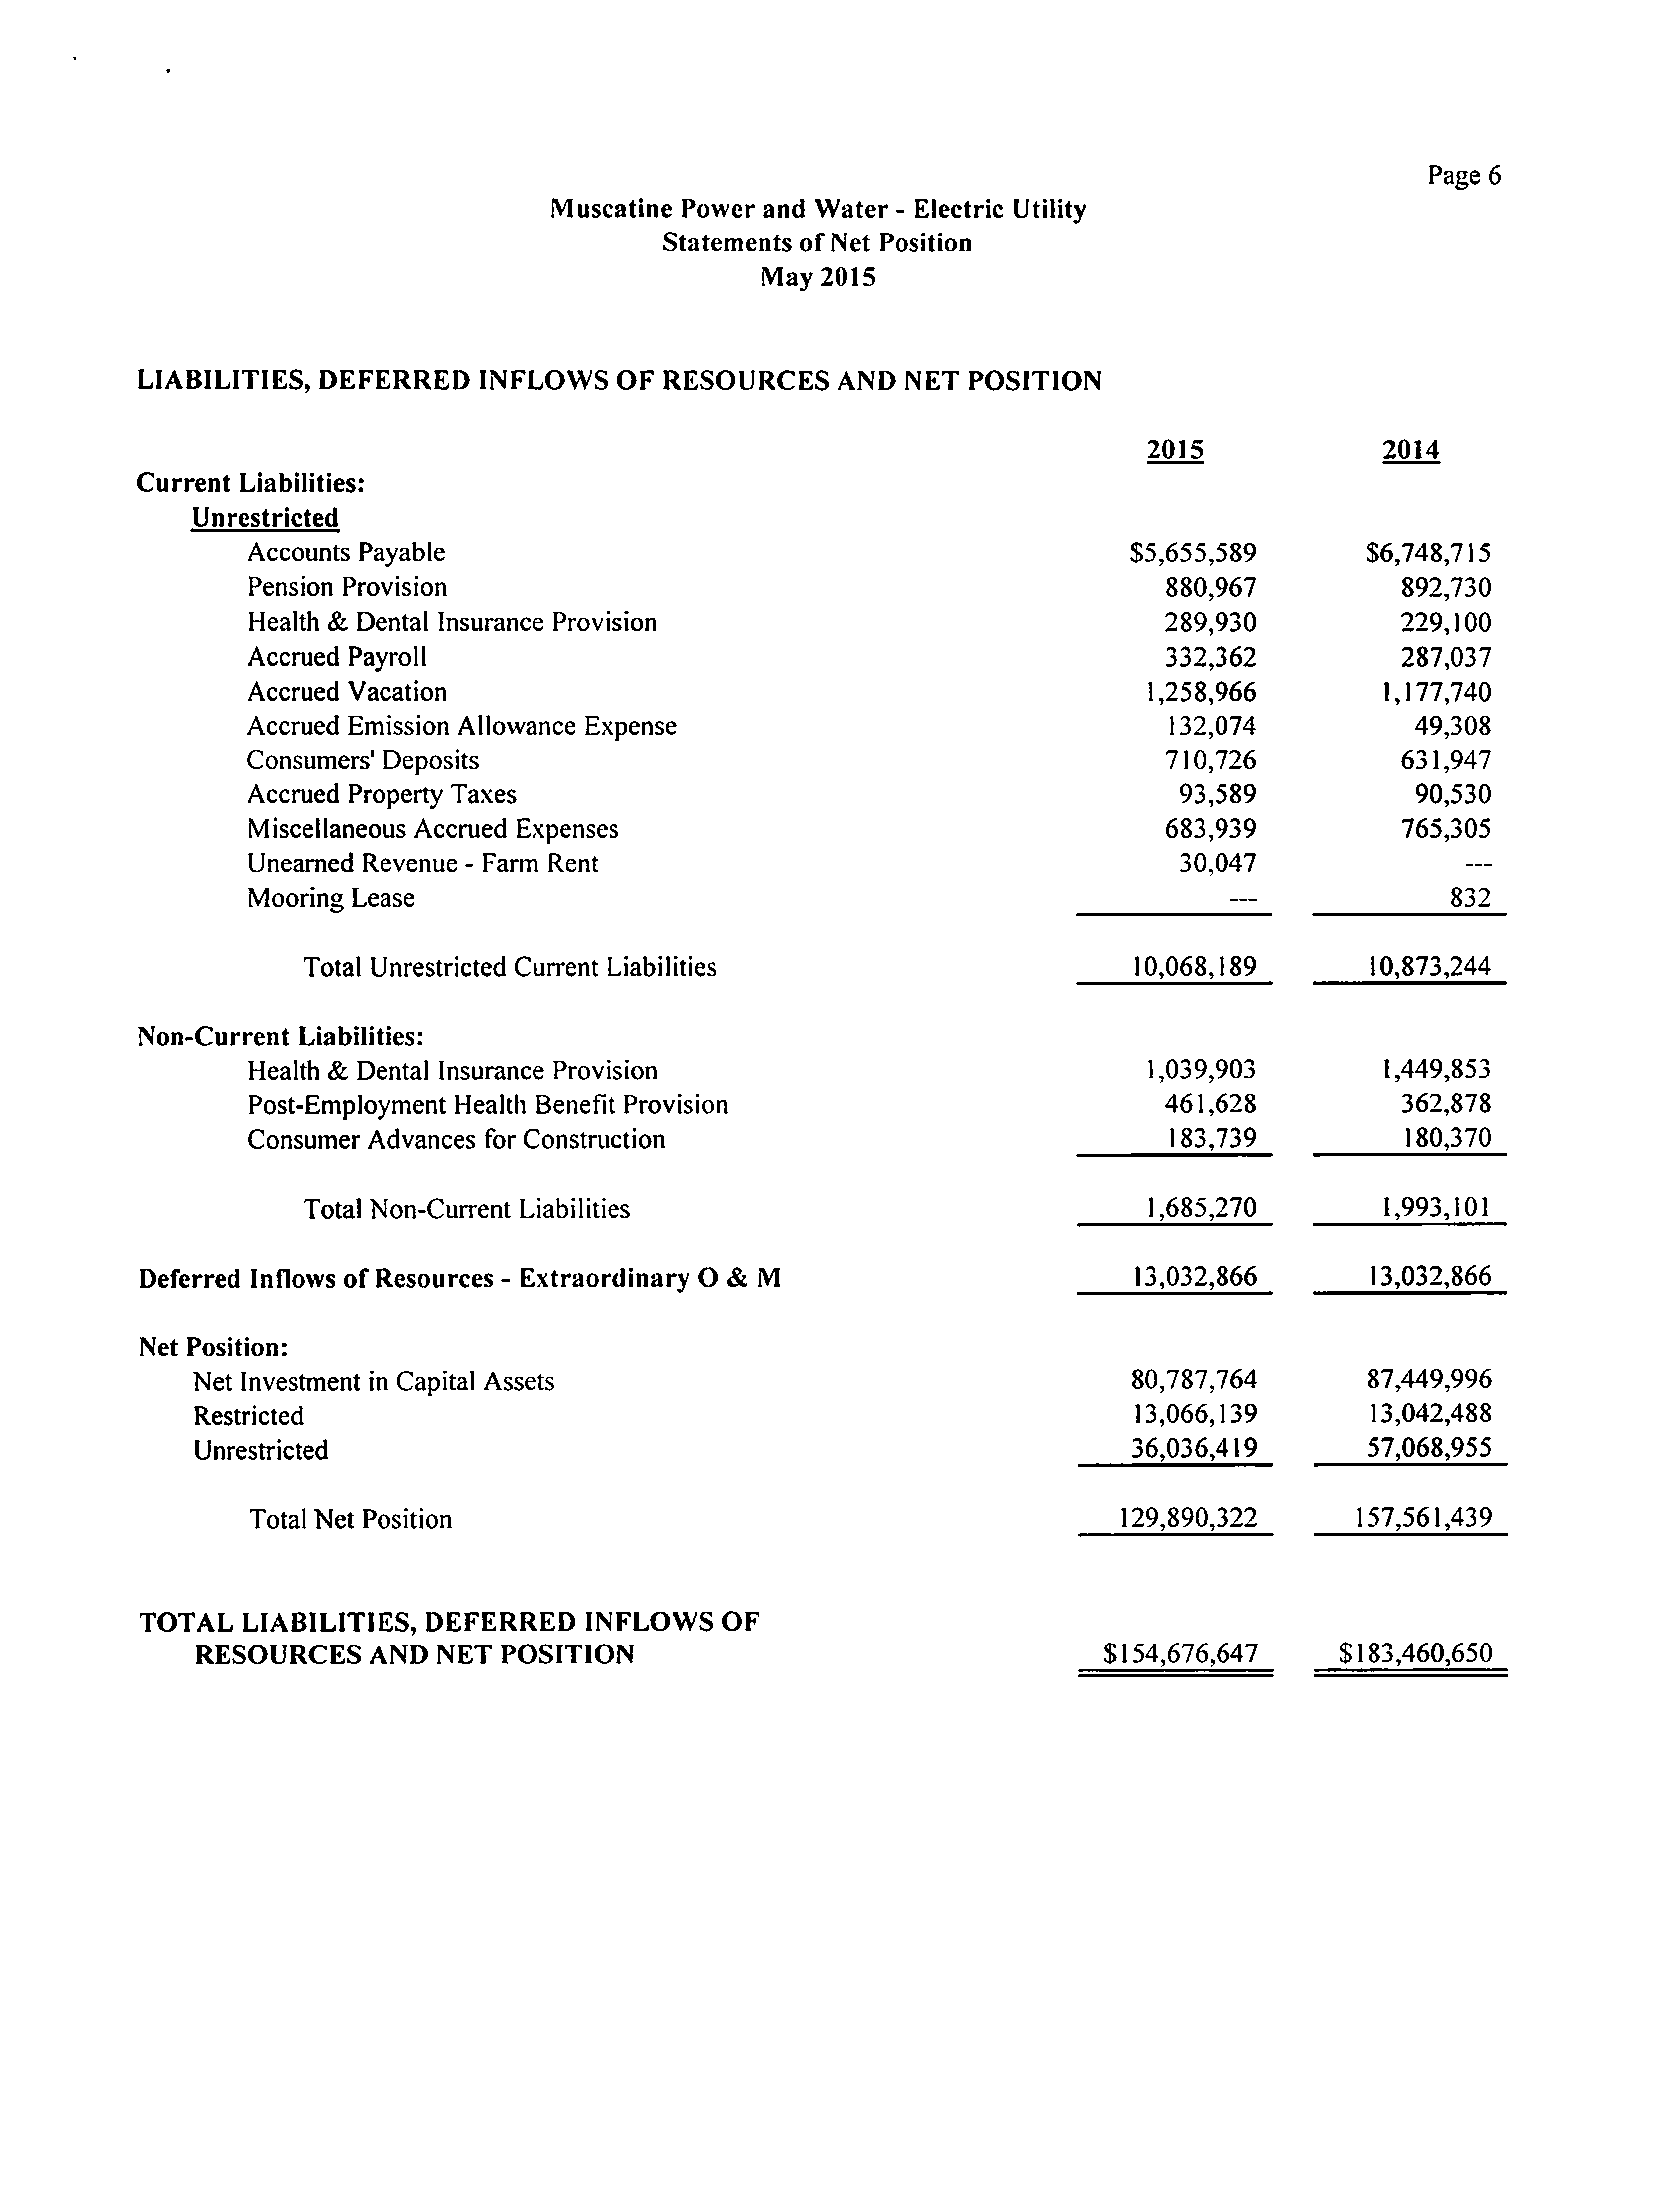
Statements ofNet Position
5-6
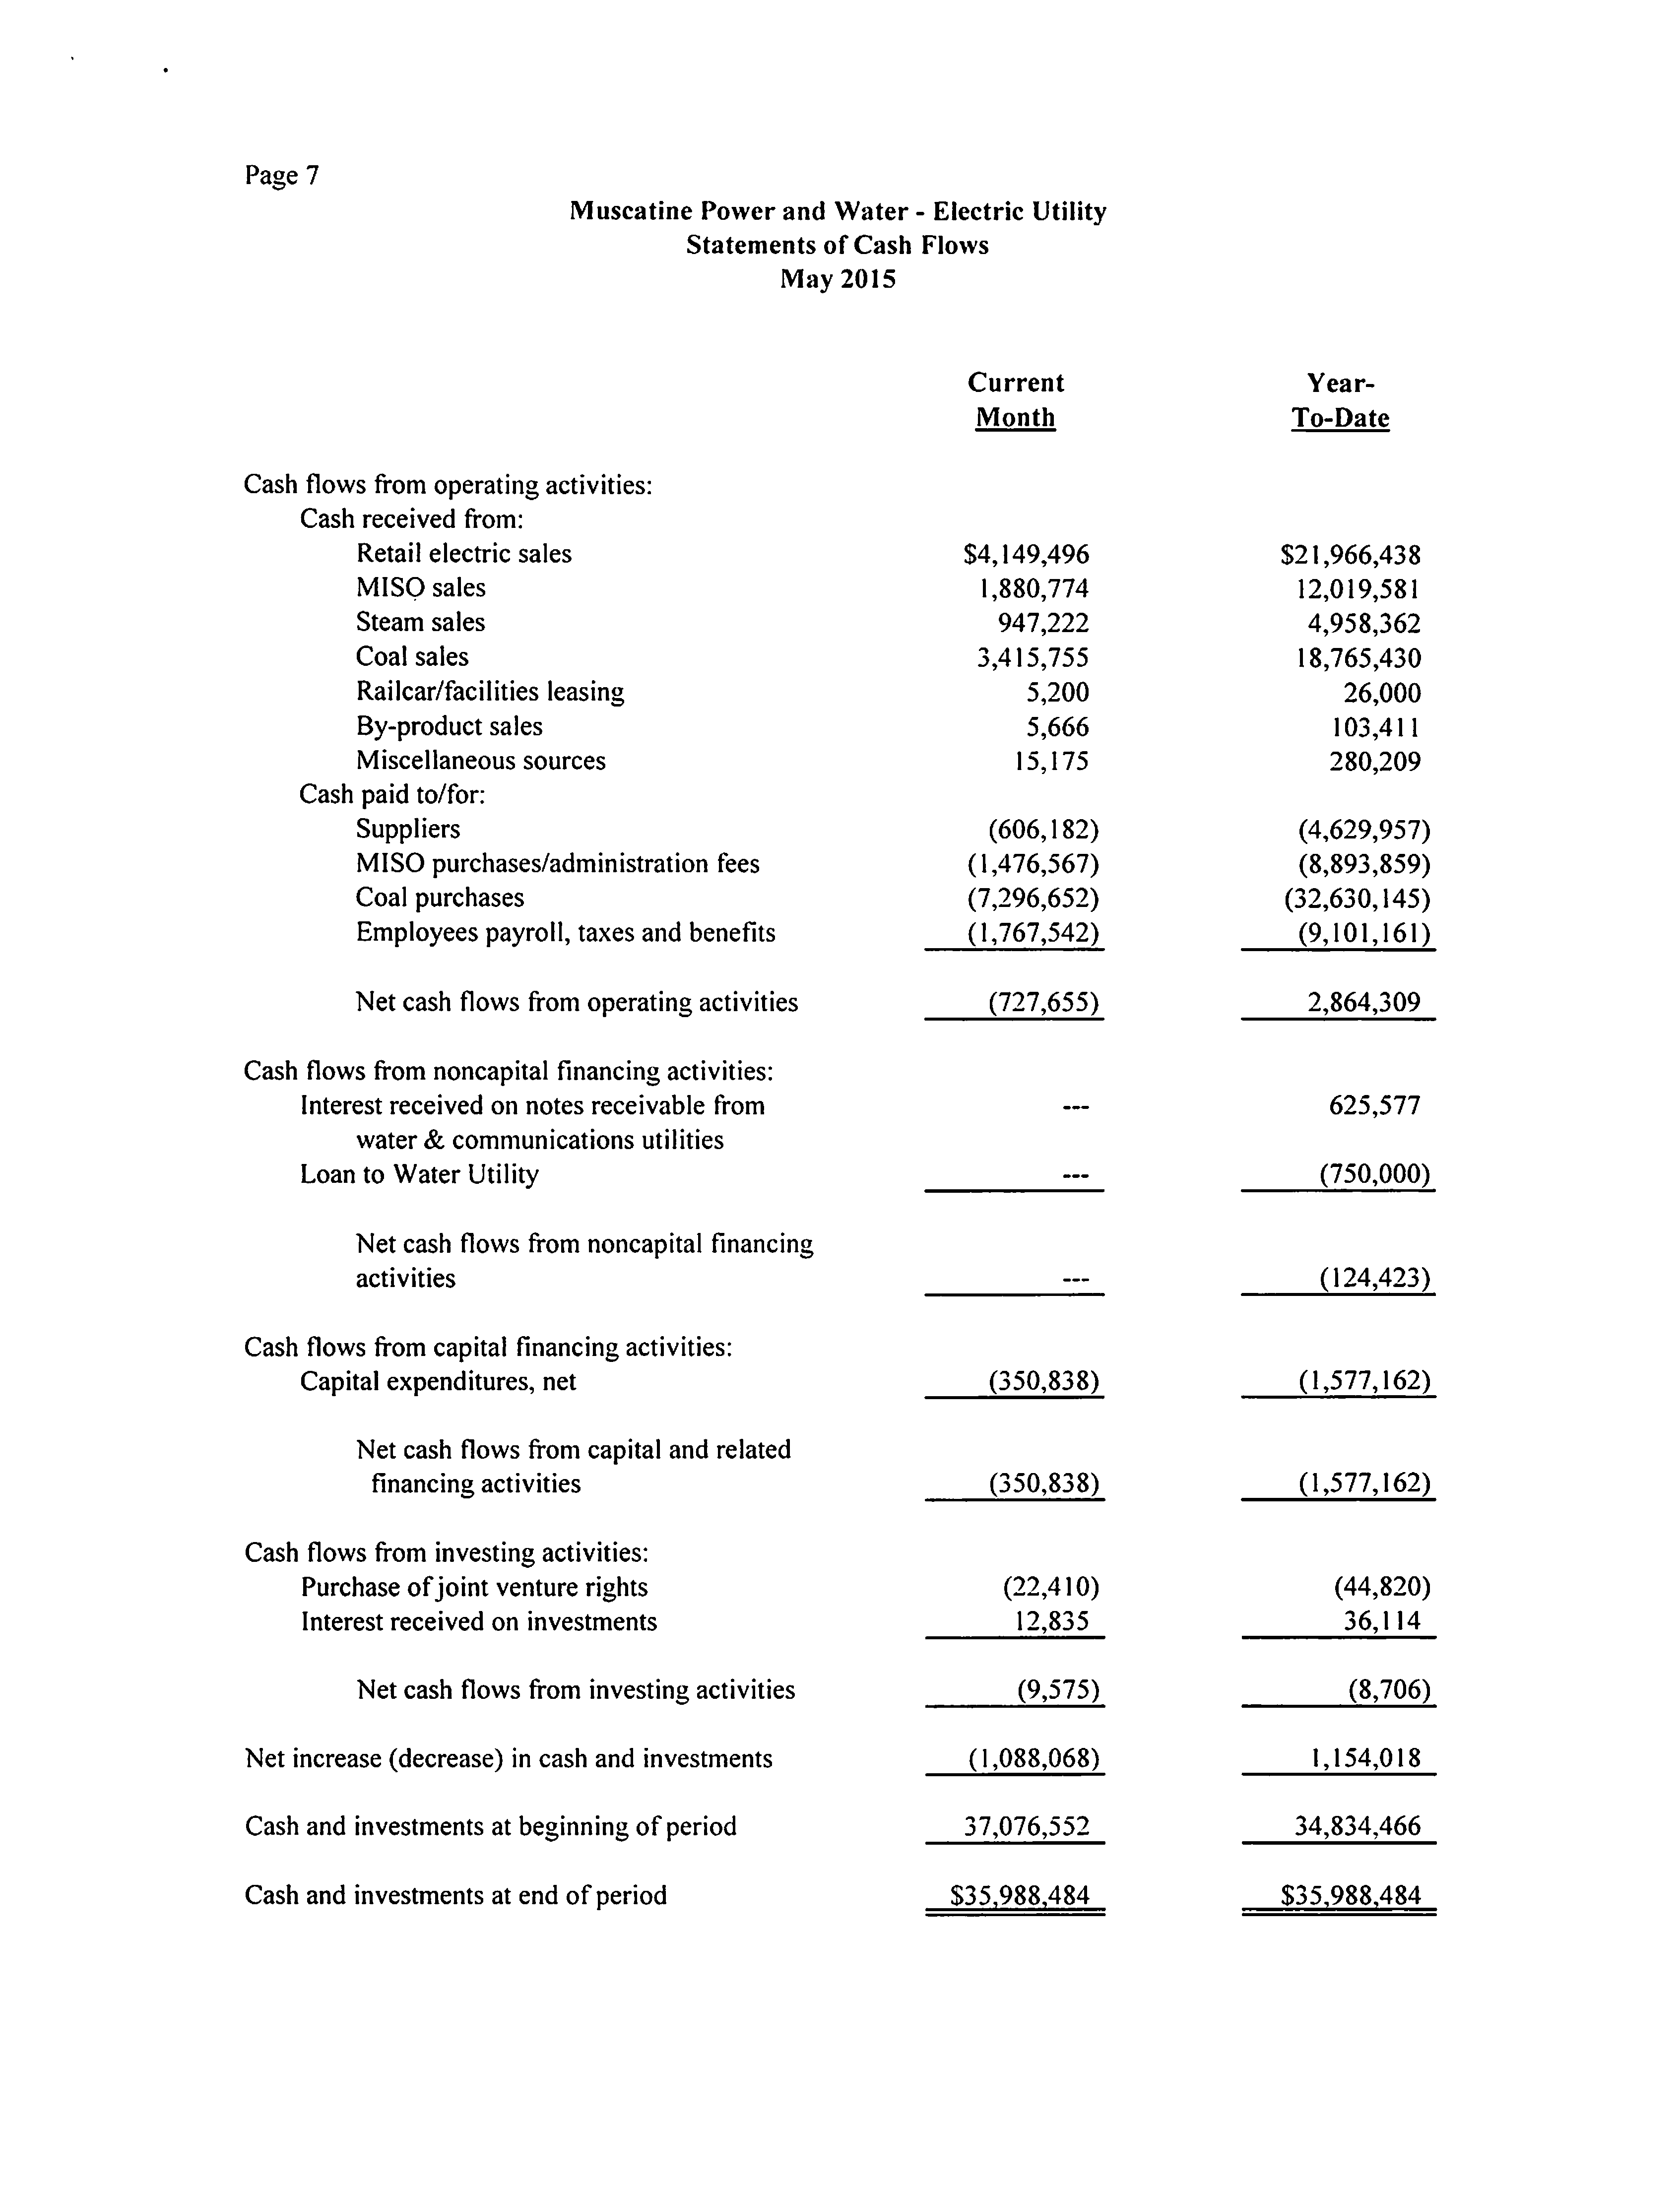
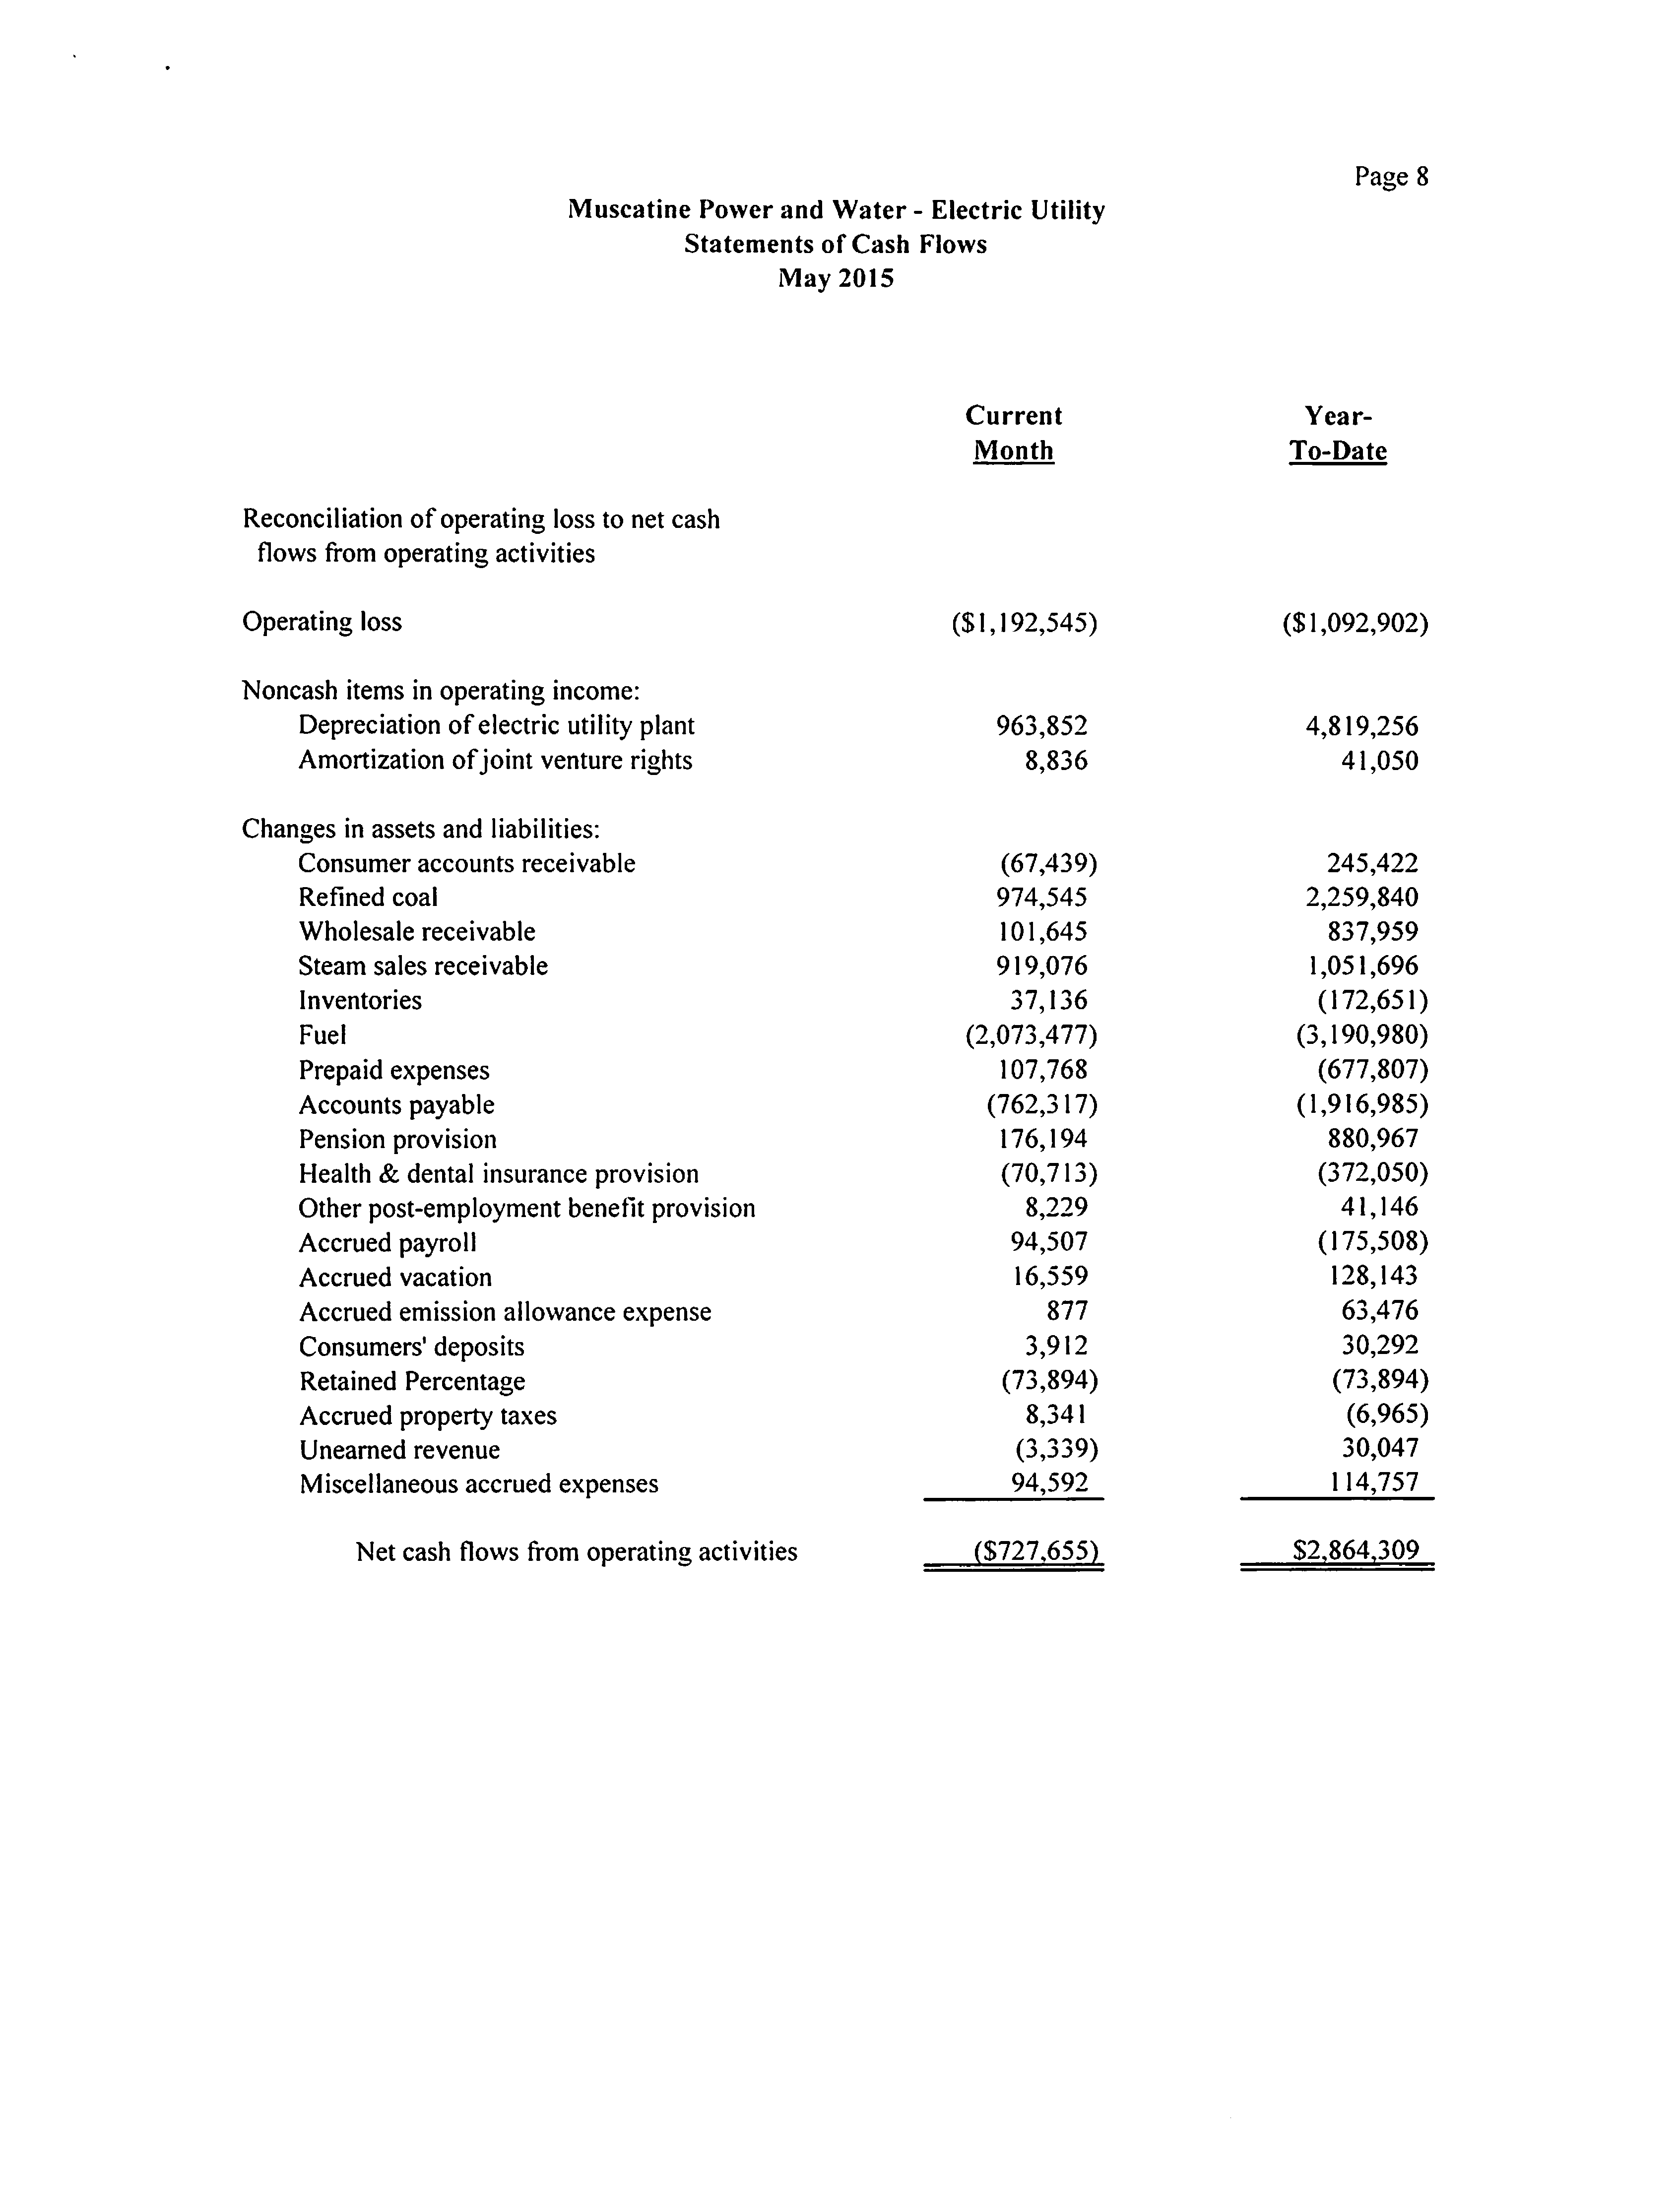
Statements of Cash Flows
7-8
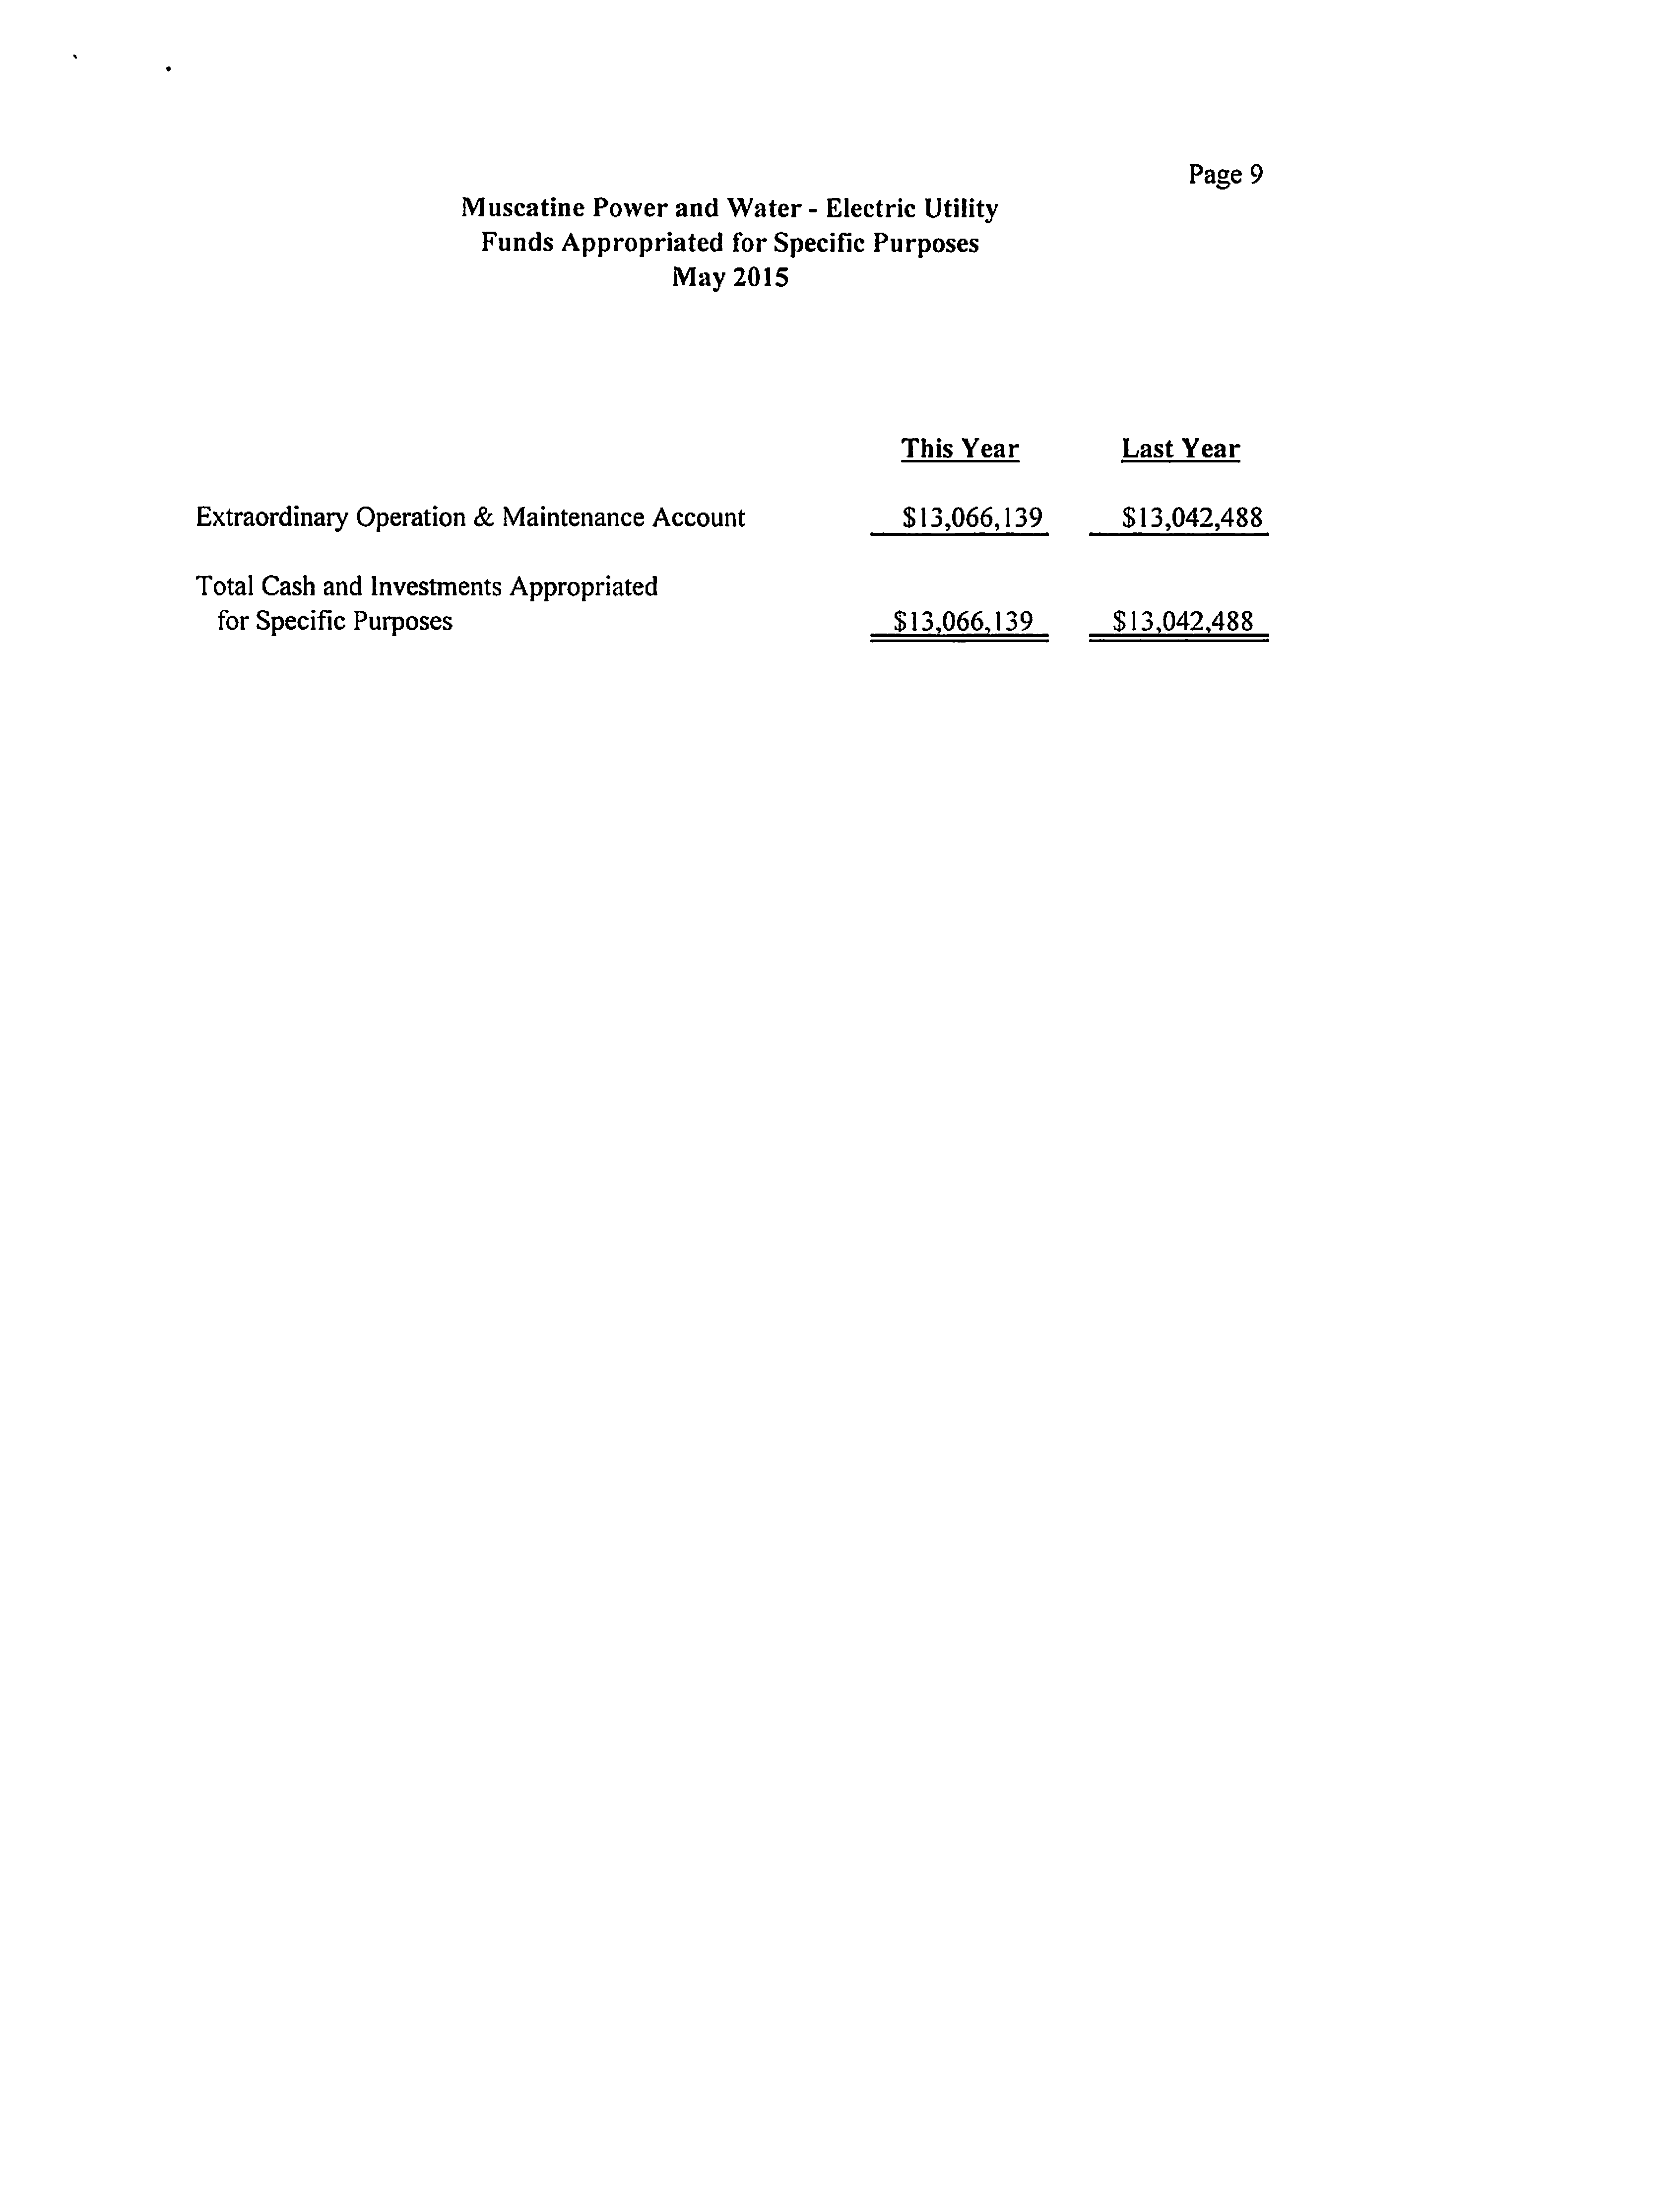
Funds Appropriated for Specific Purposes
9
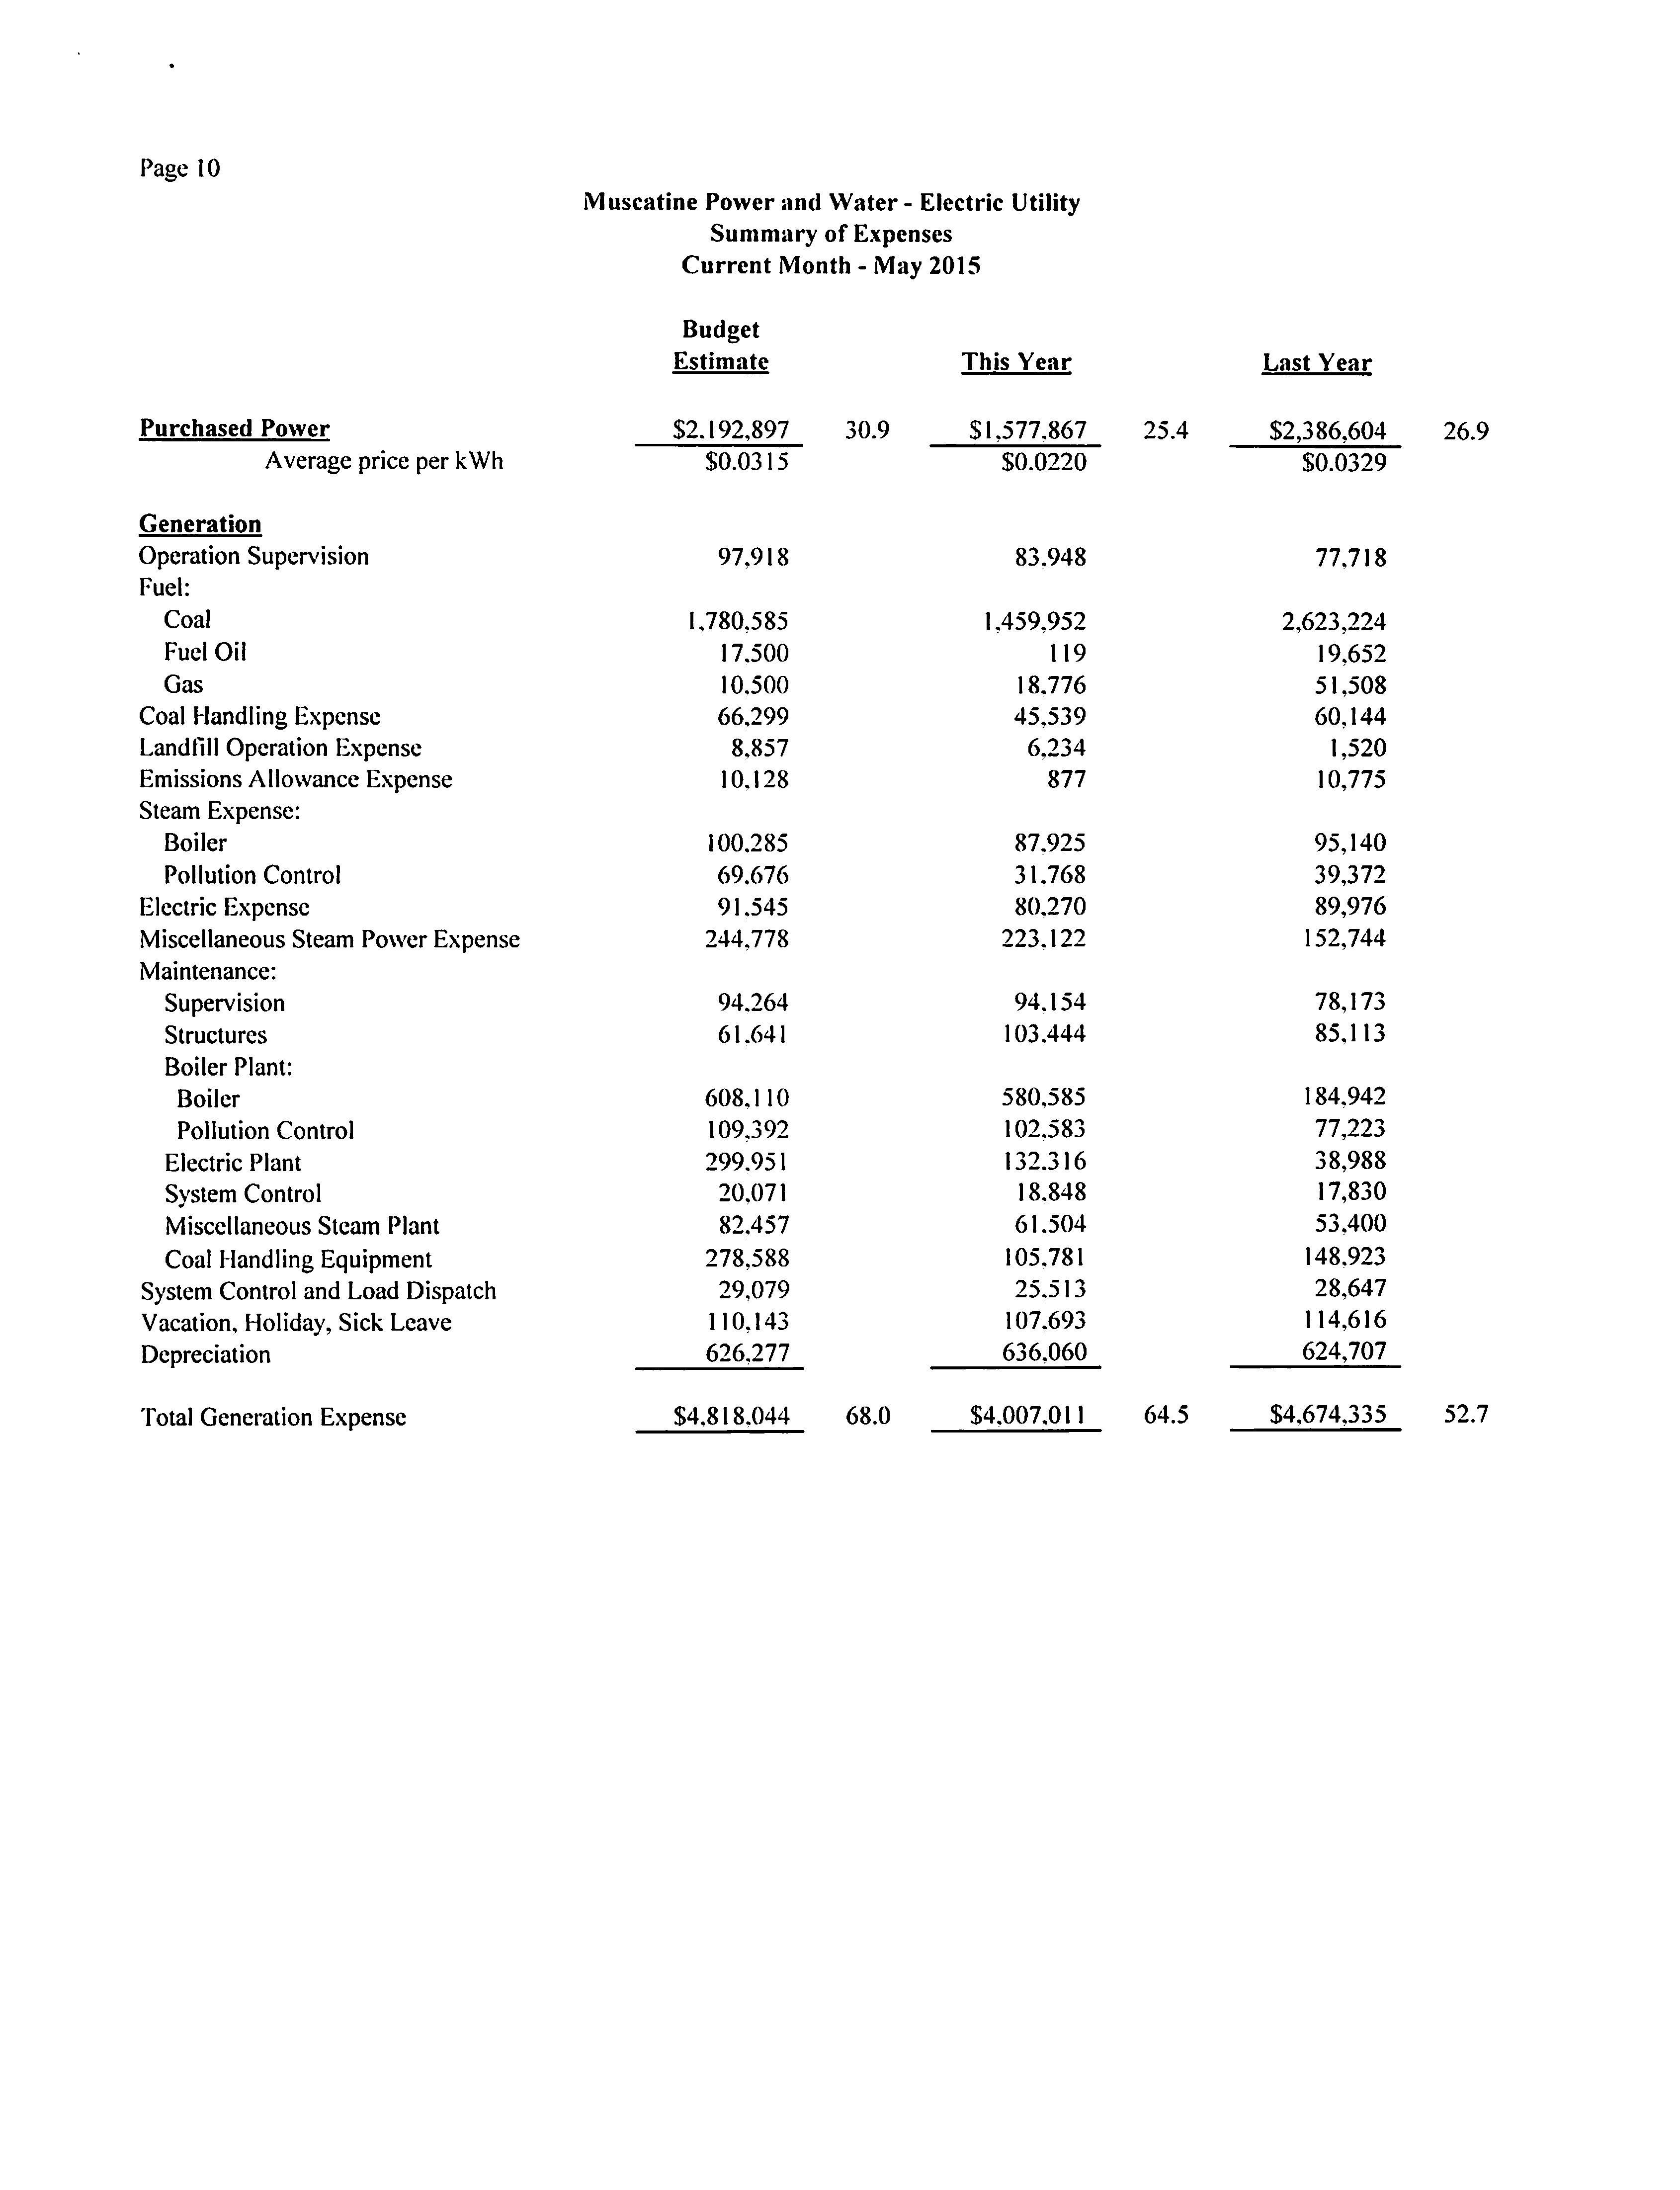
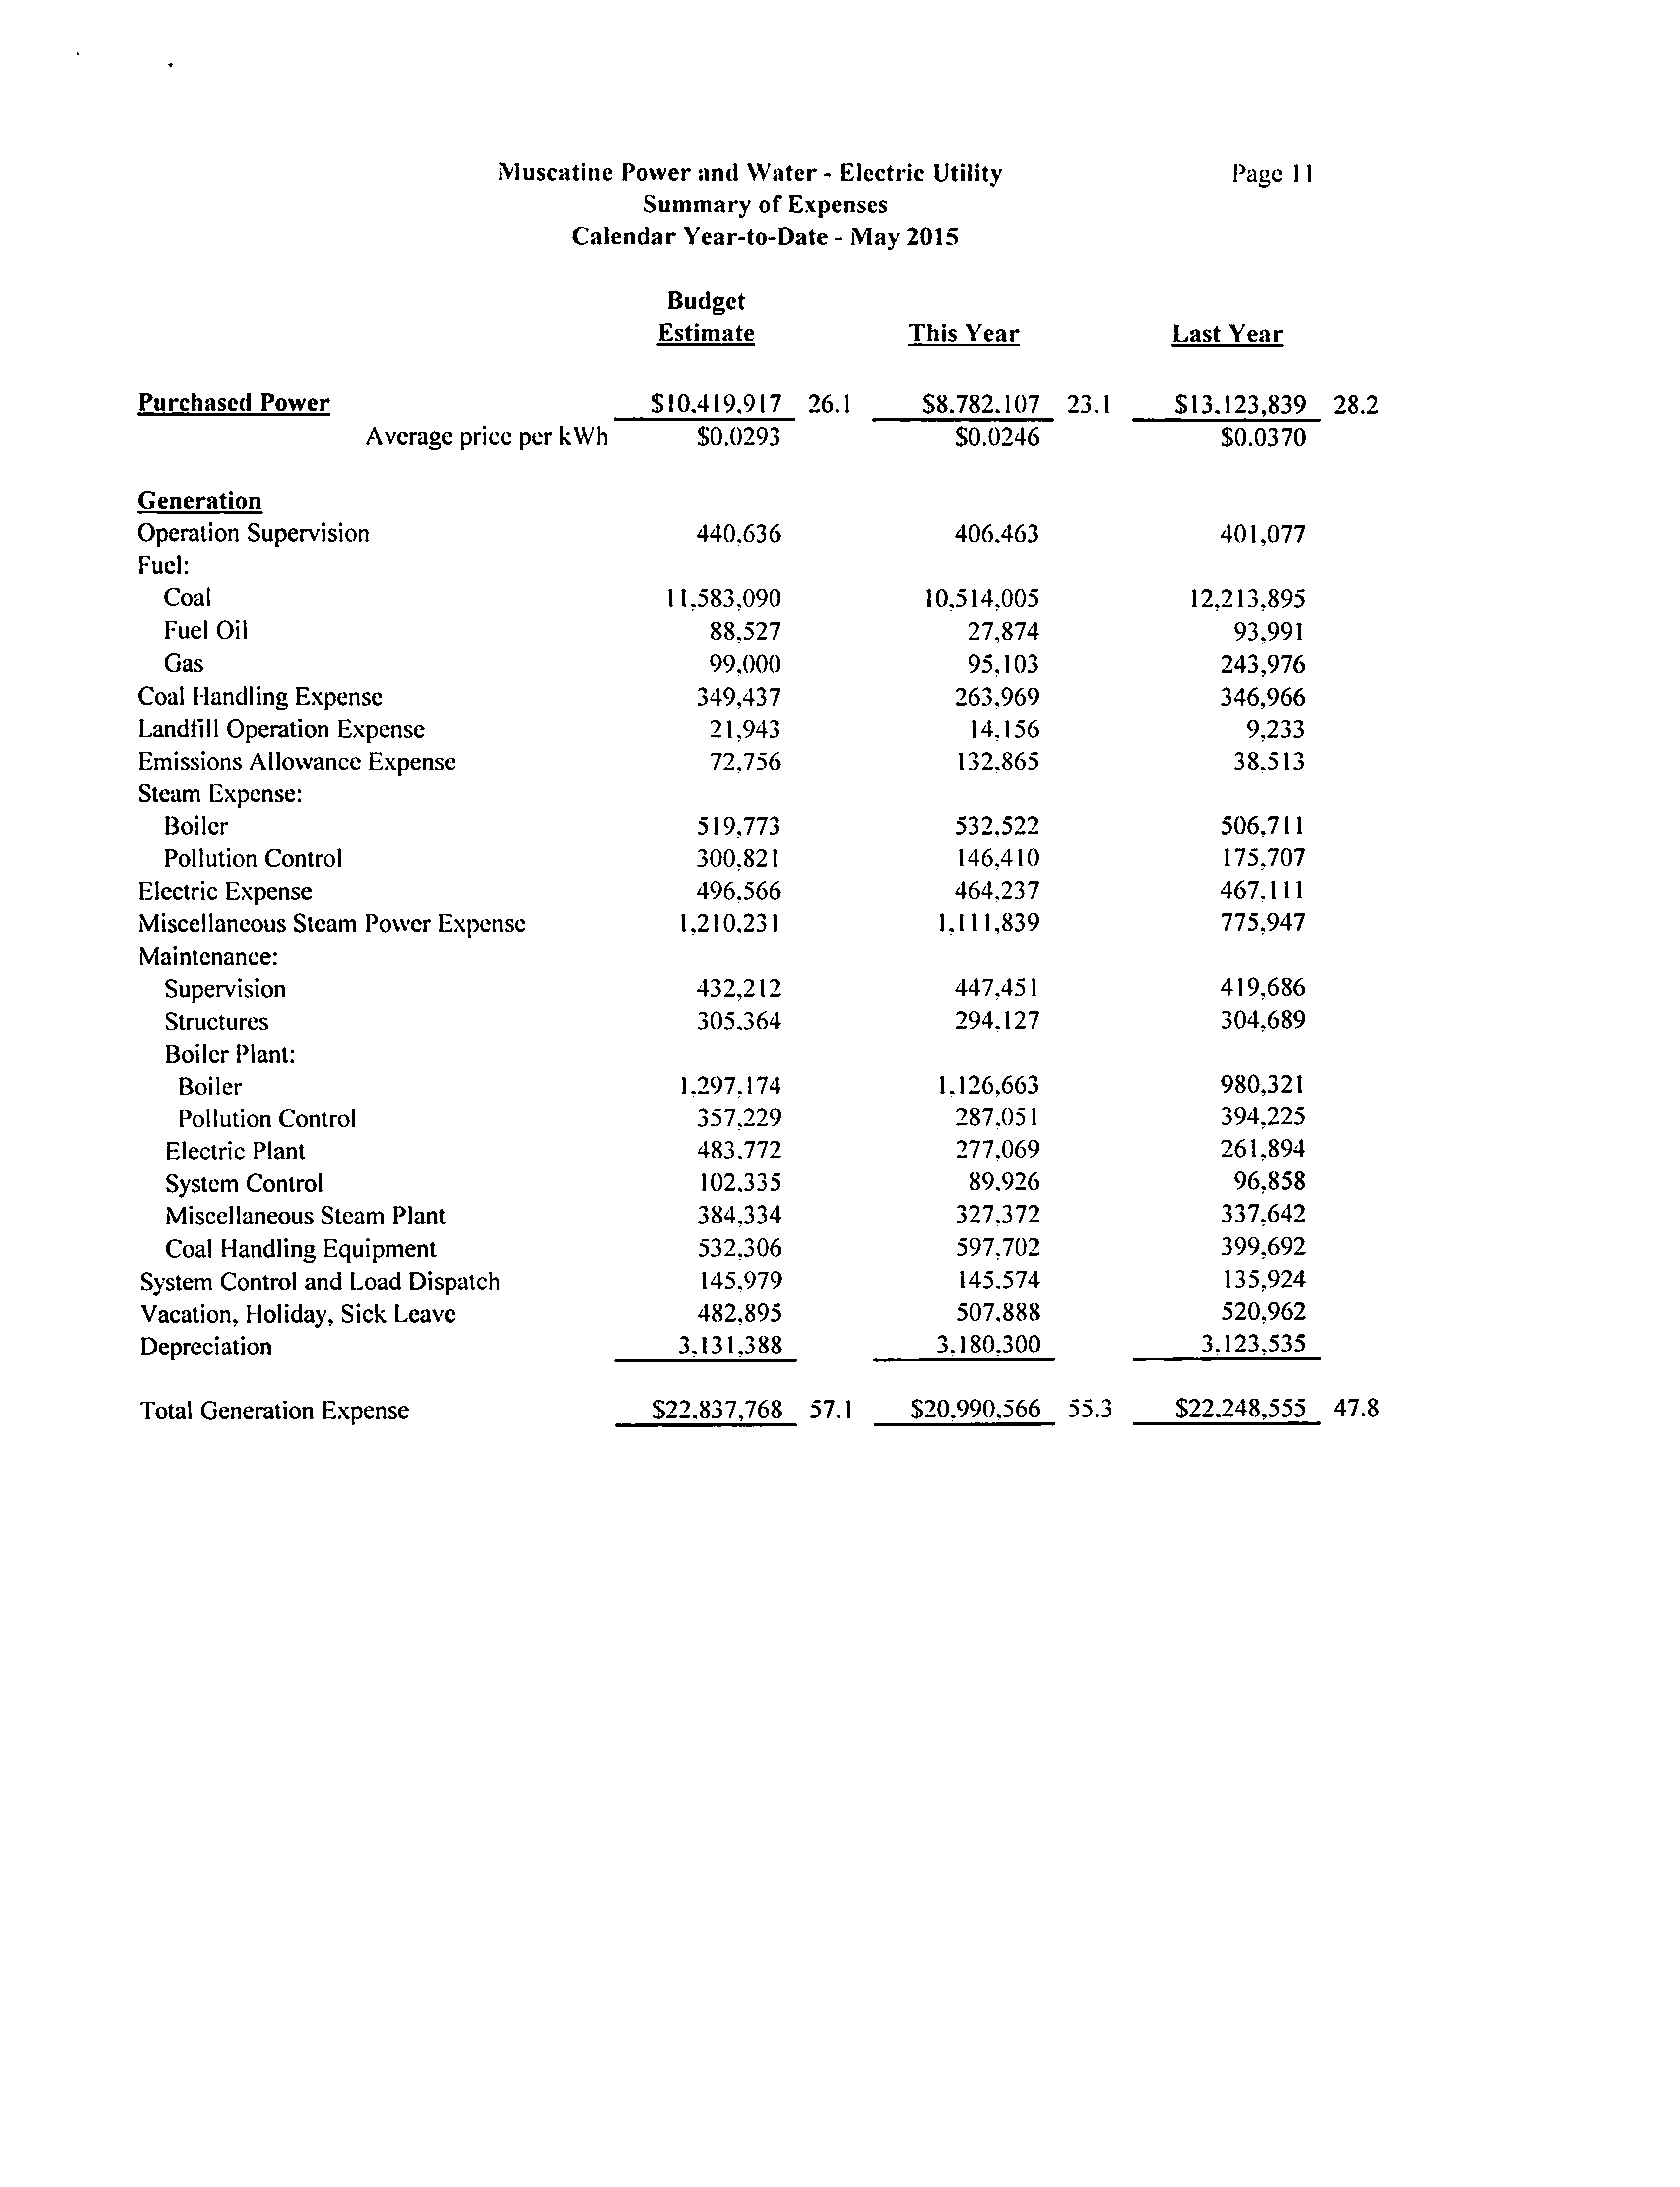
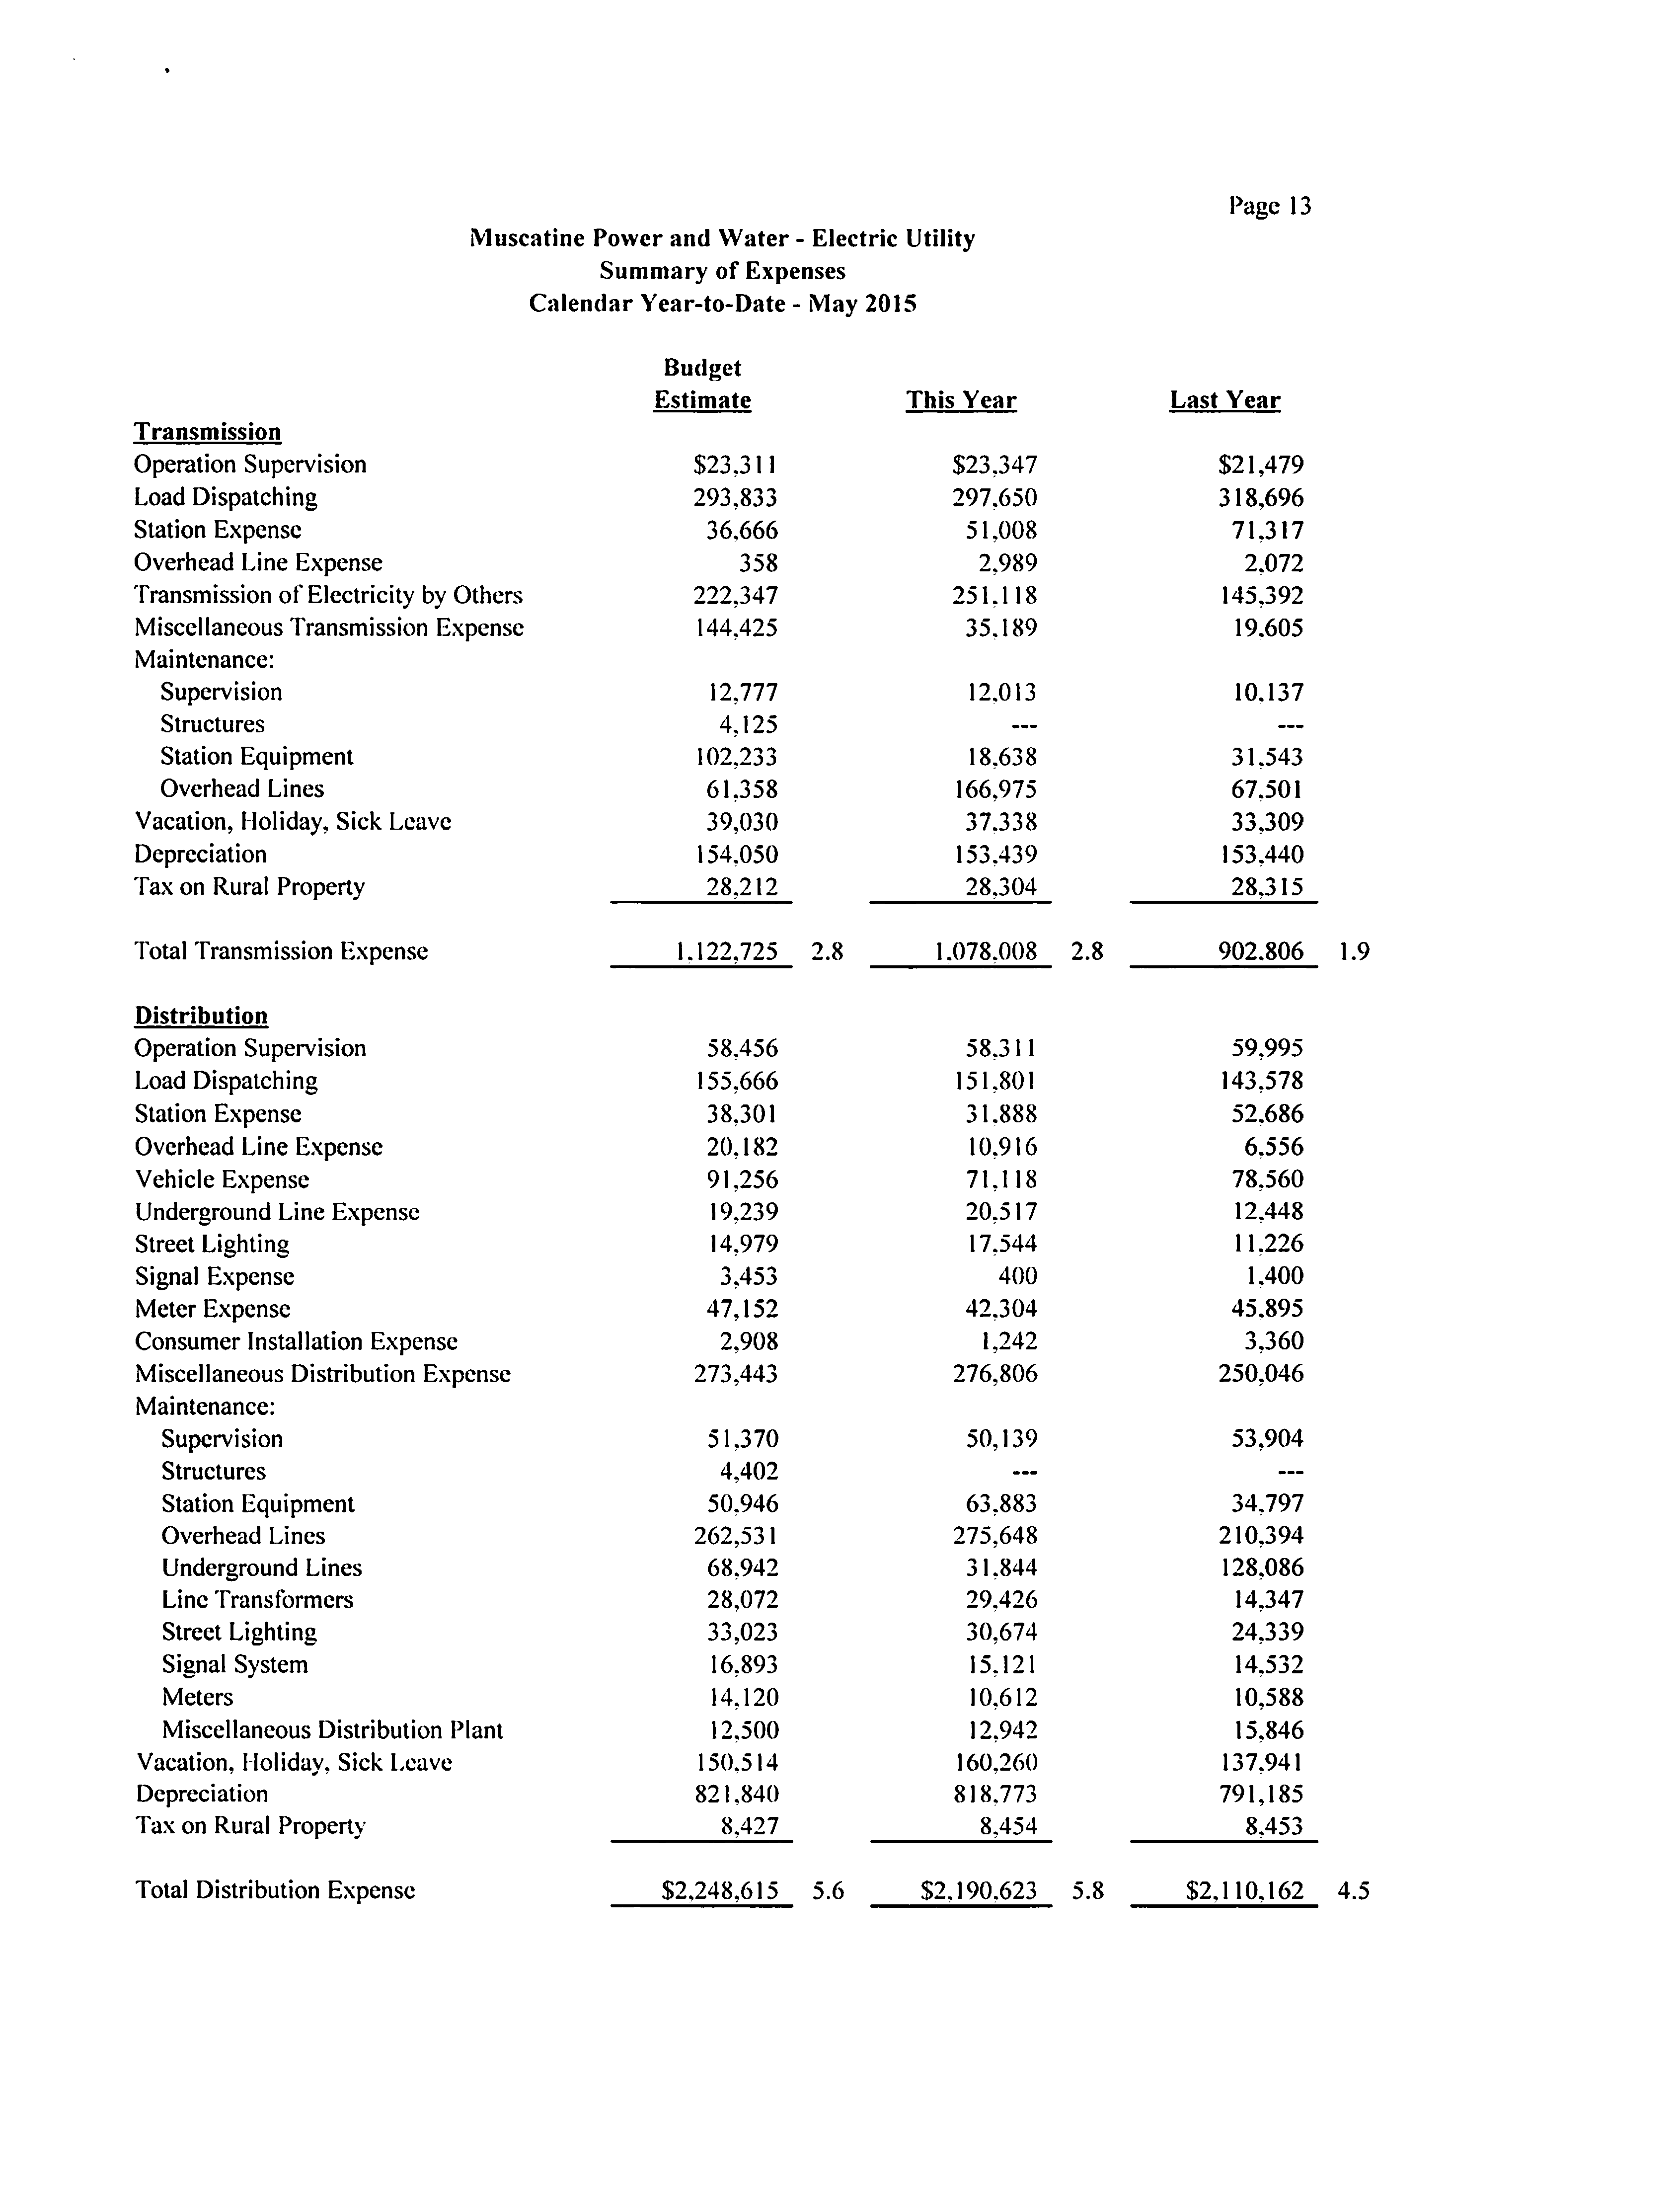
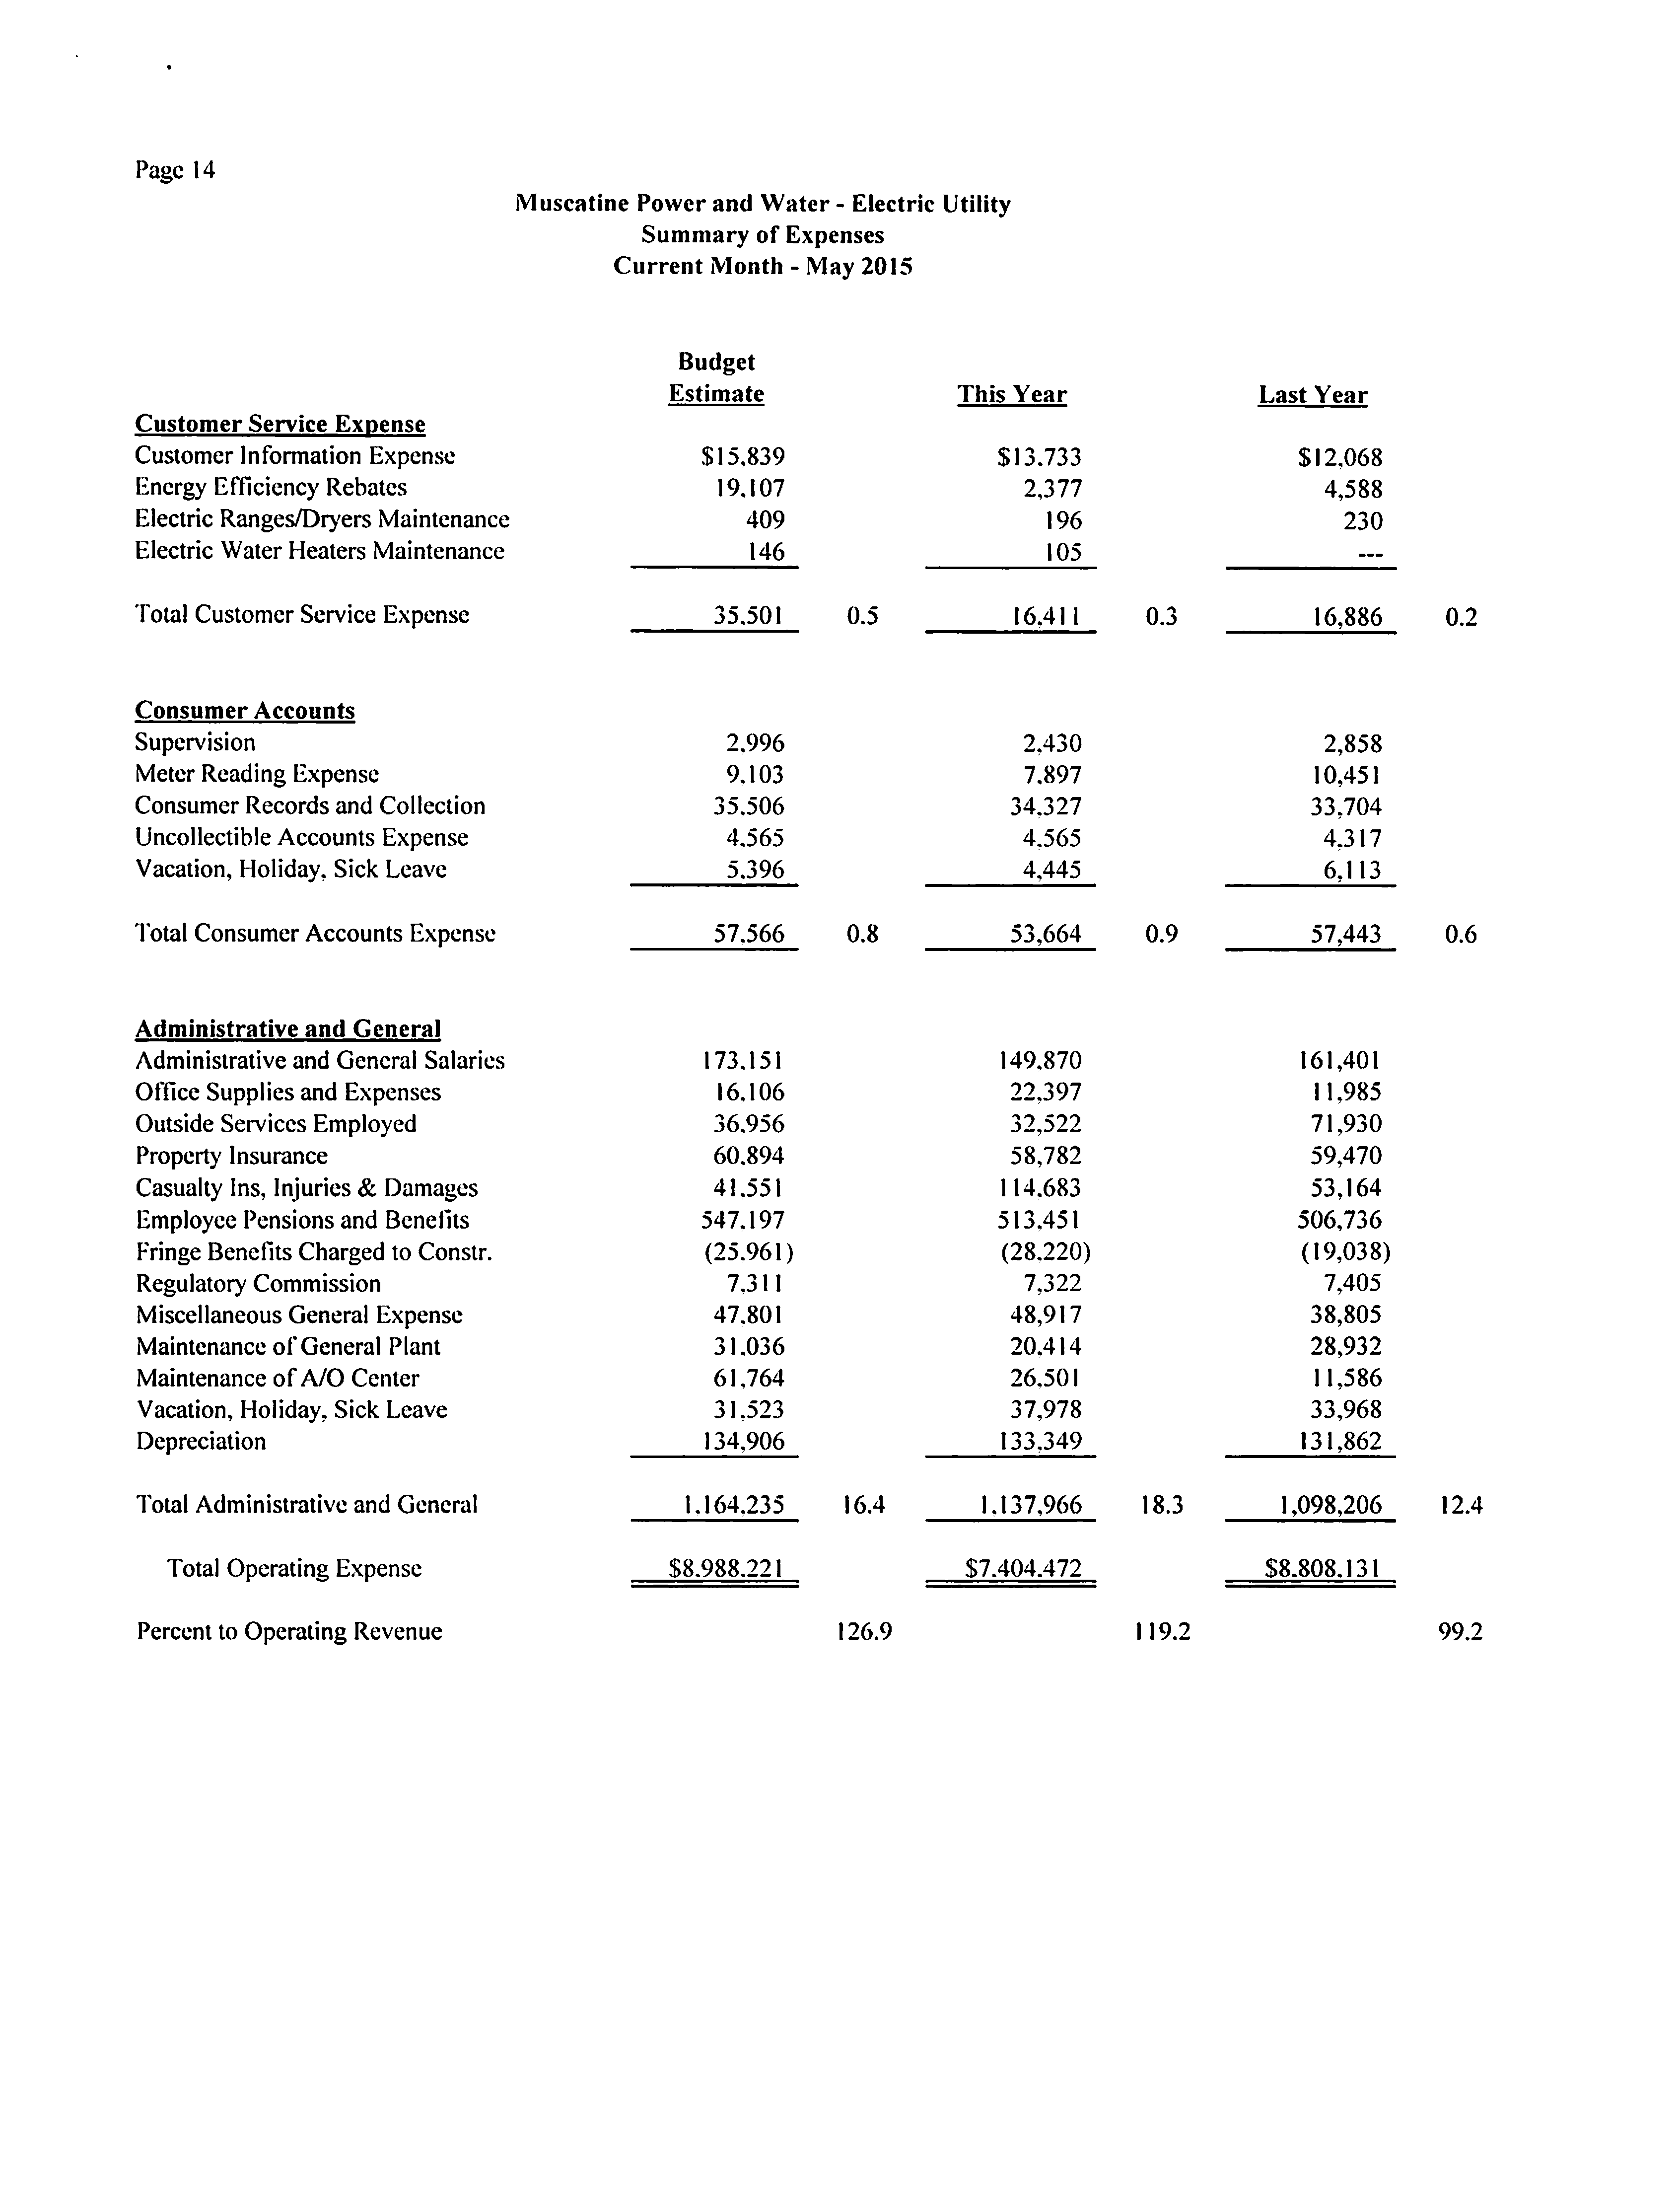
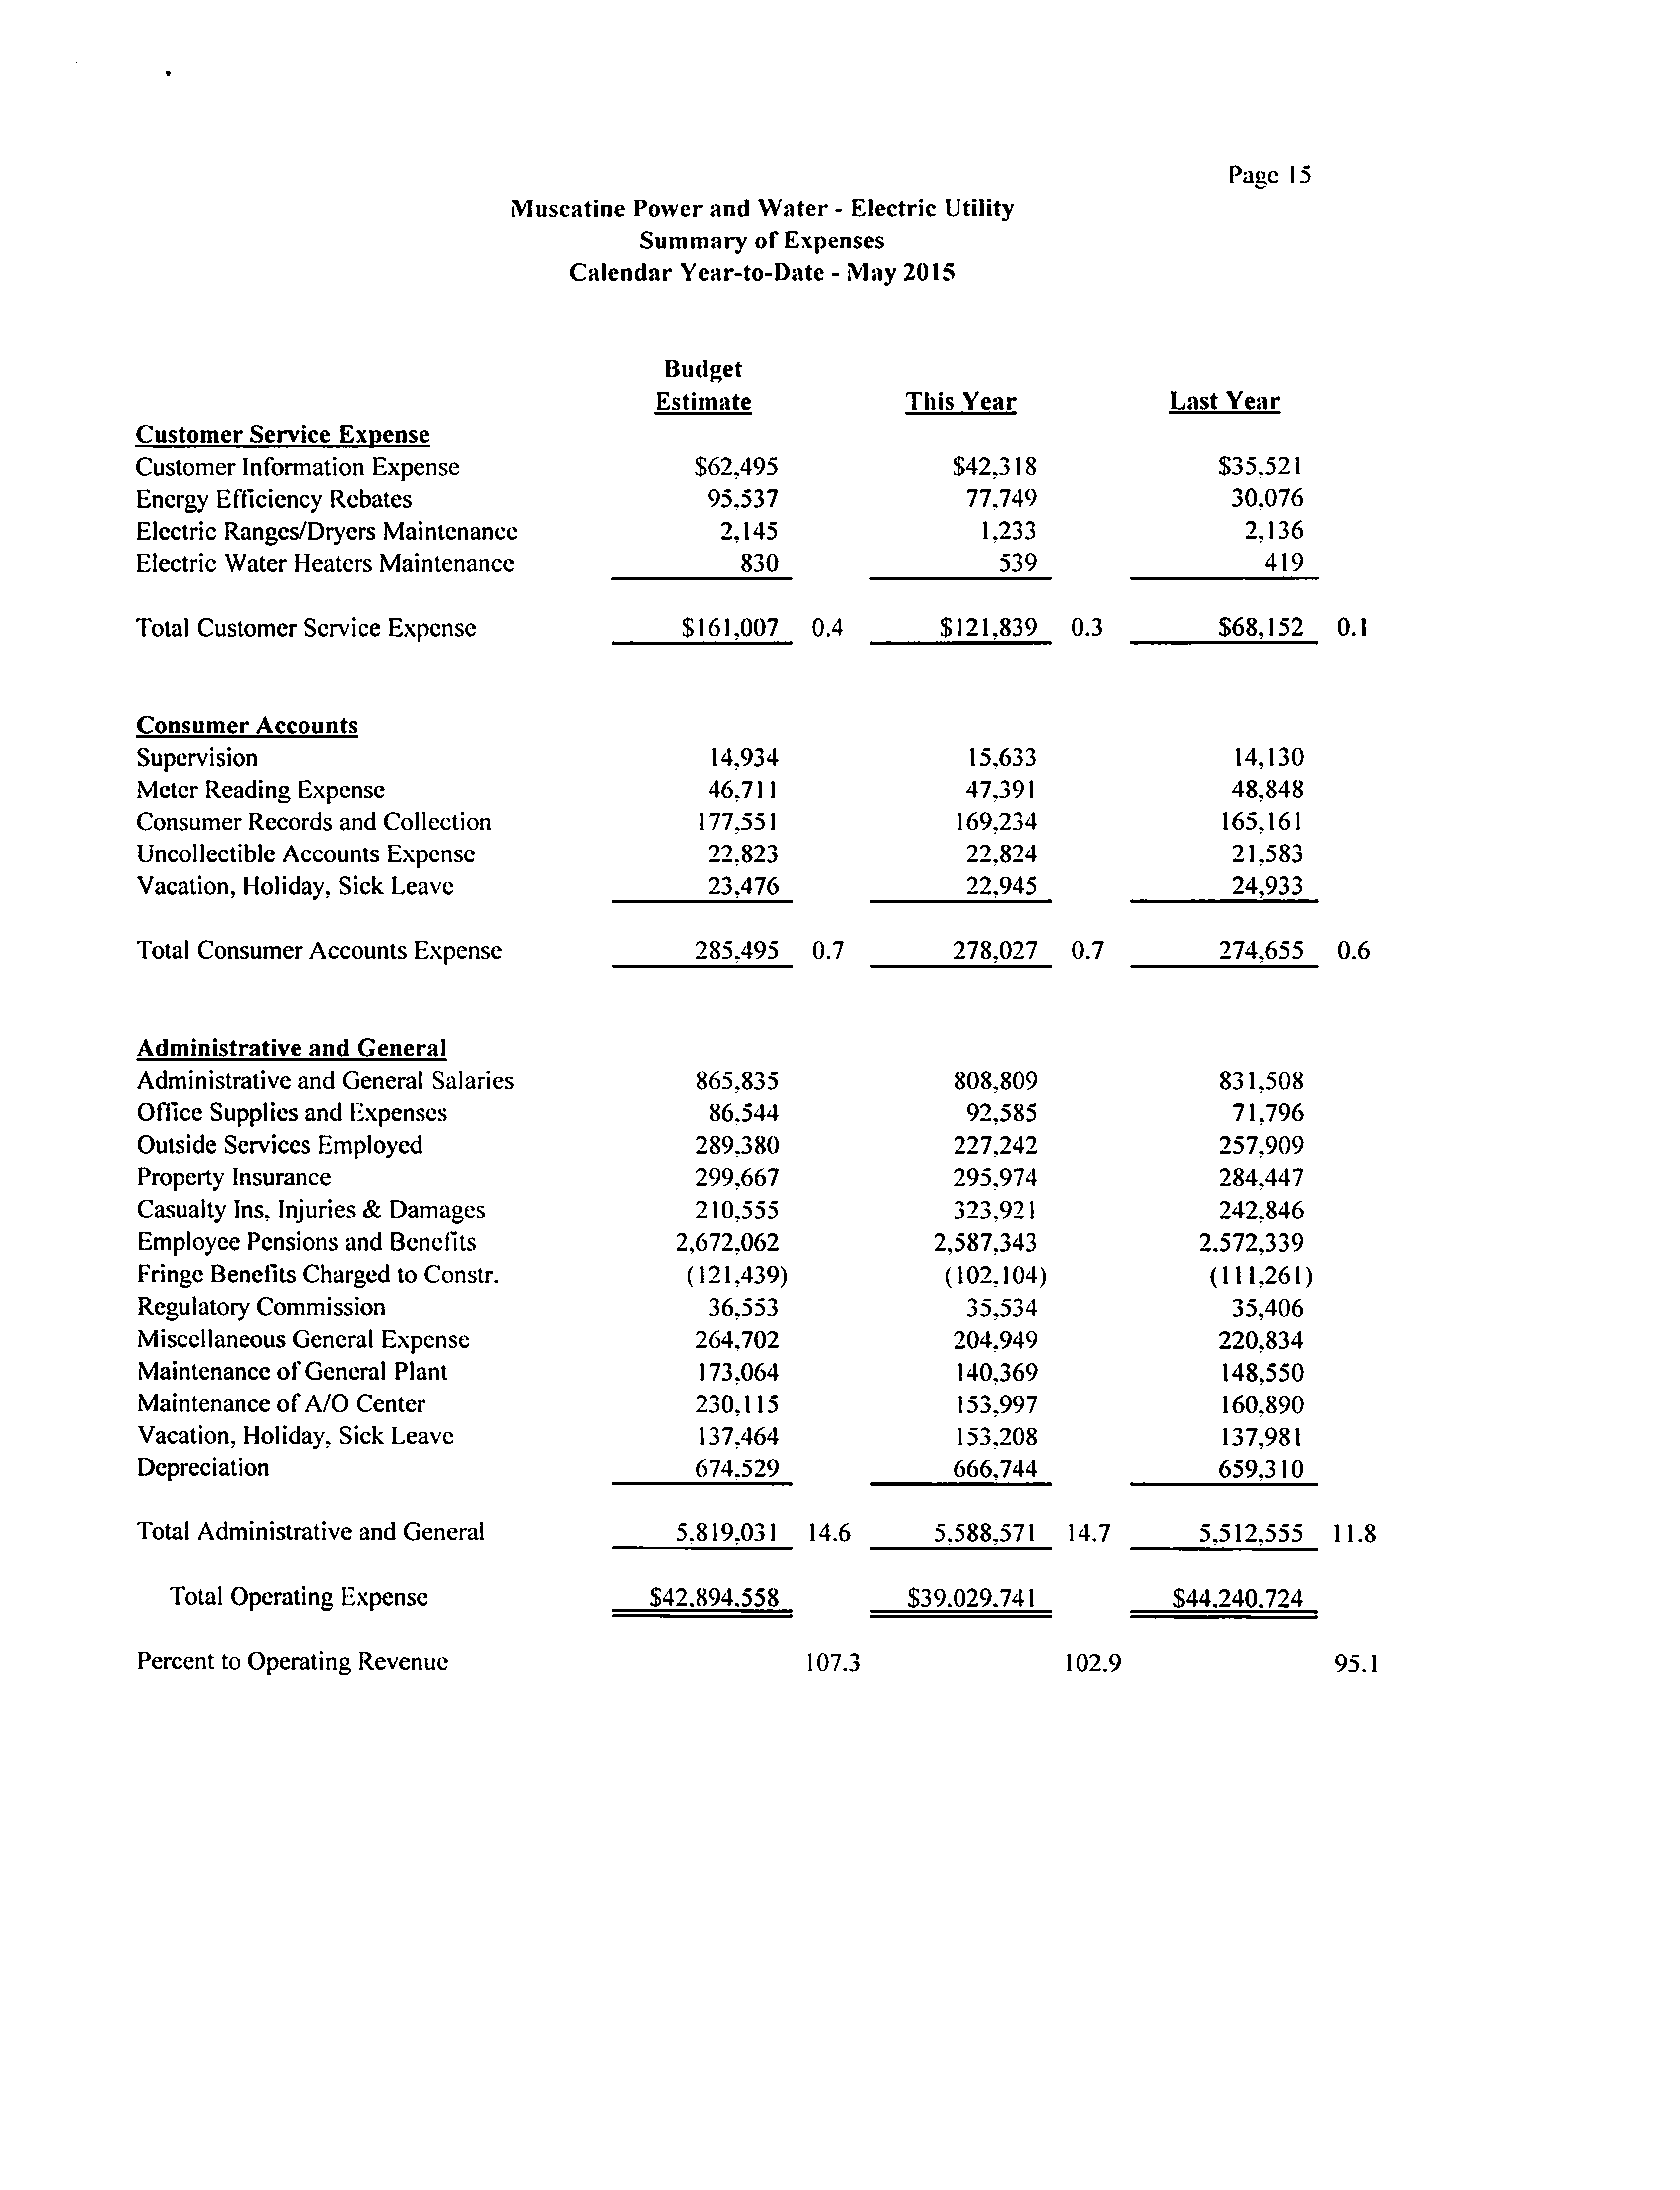
Summary of Expenses
10- 15
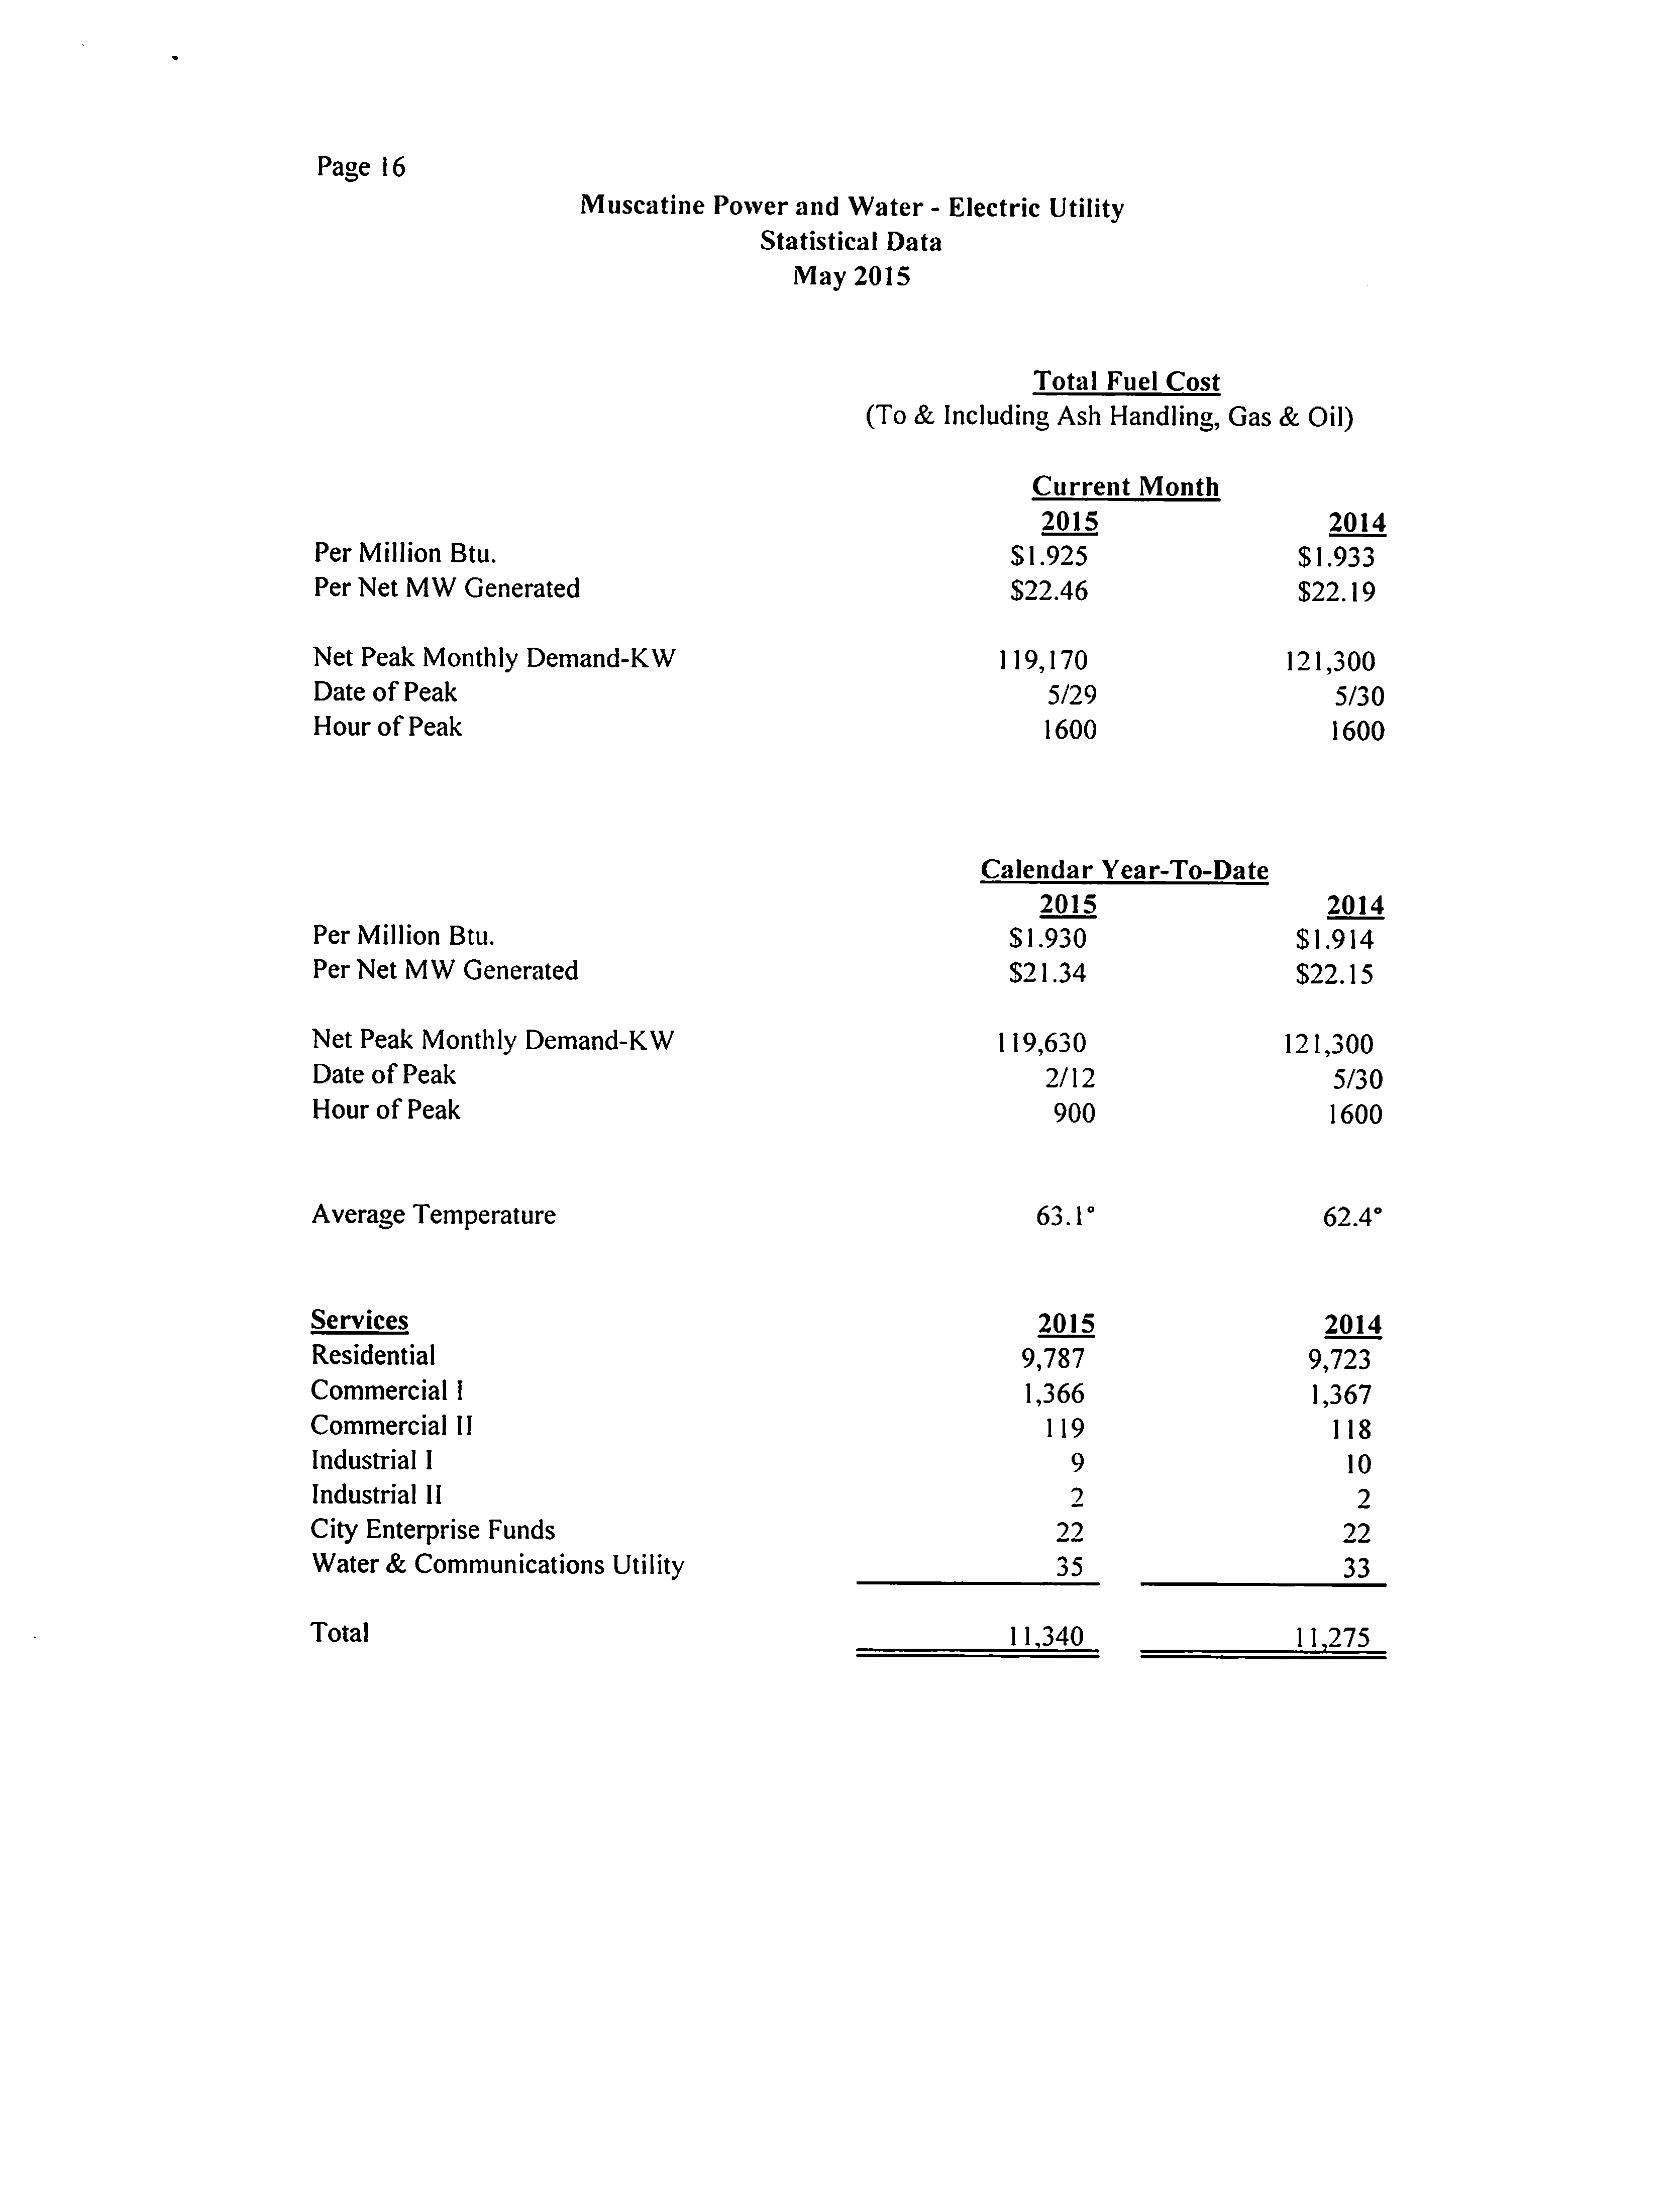
Statistical Data
16
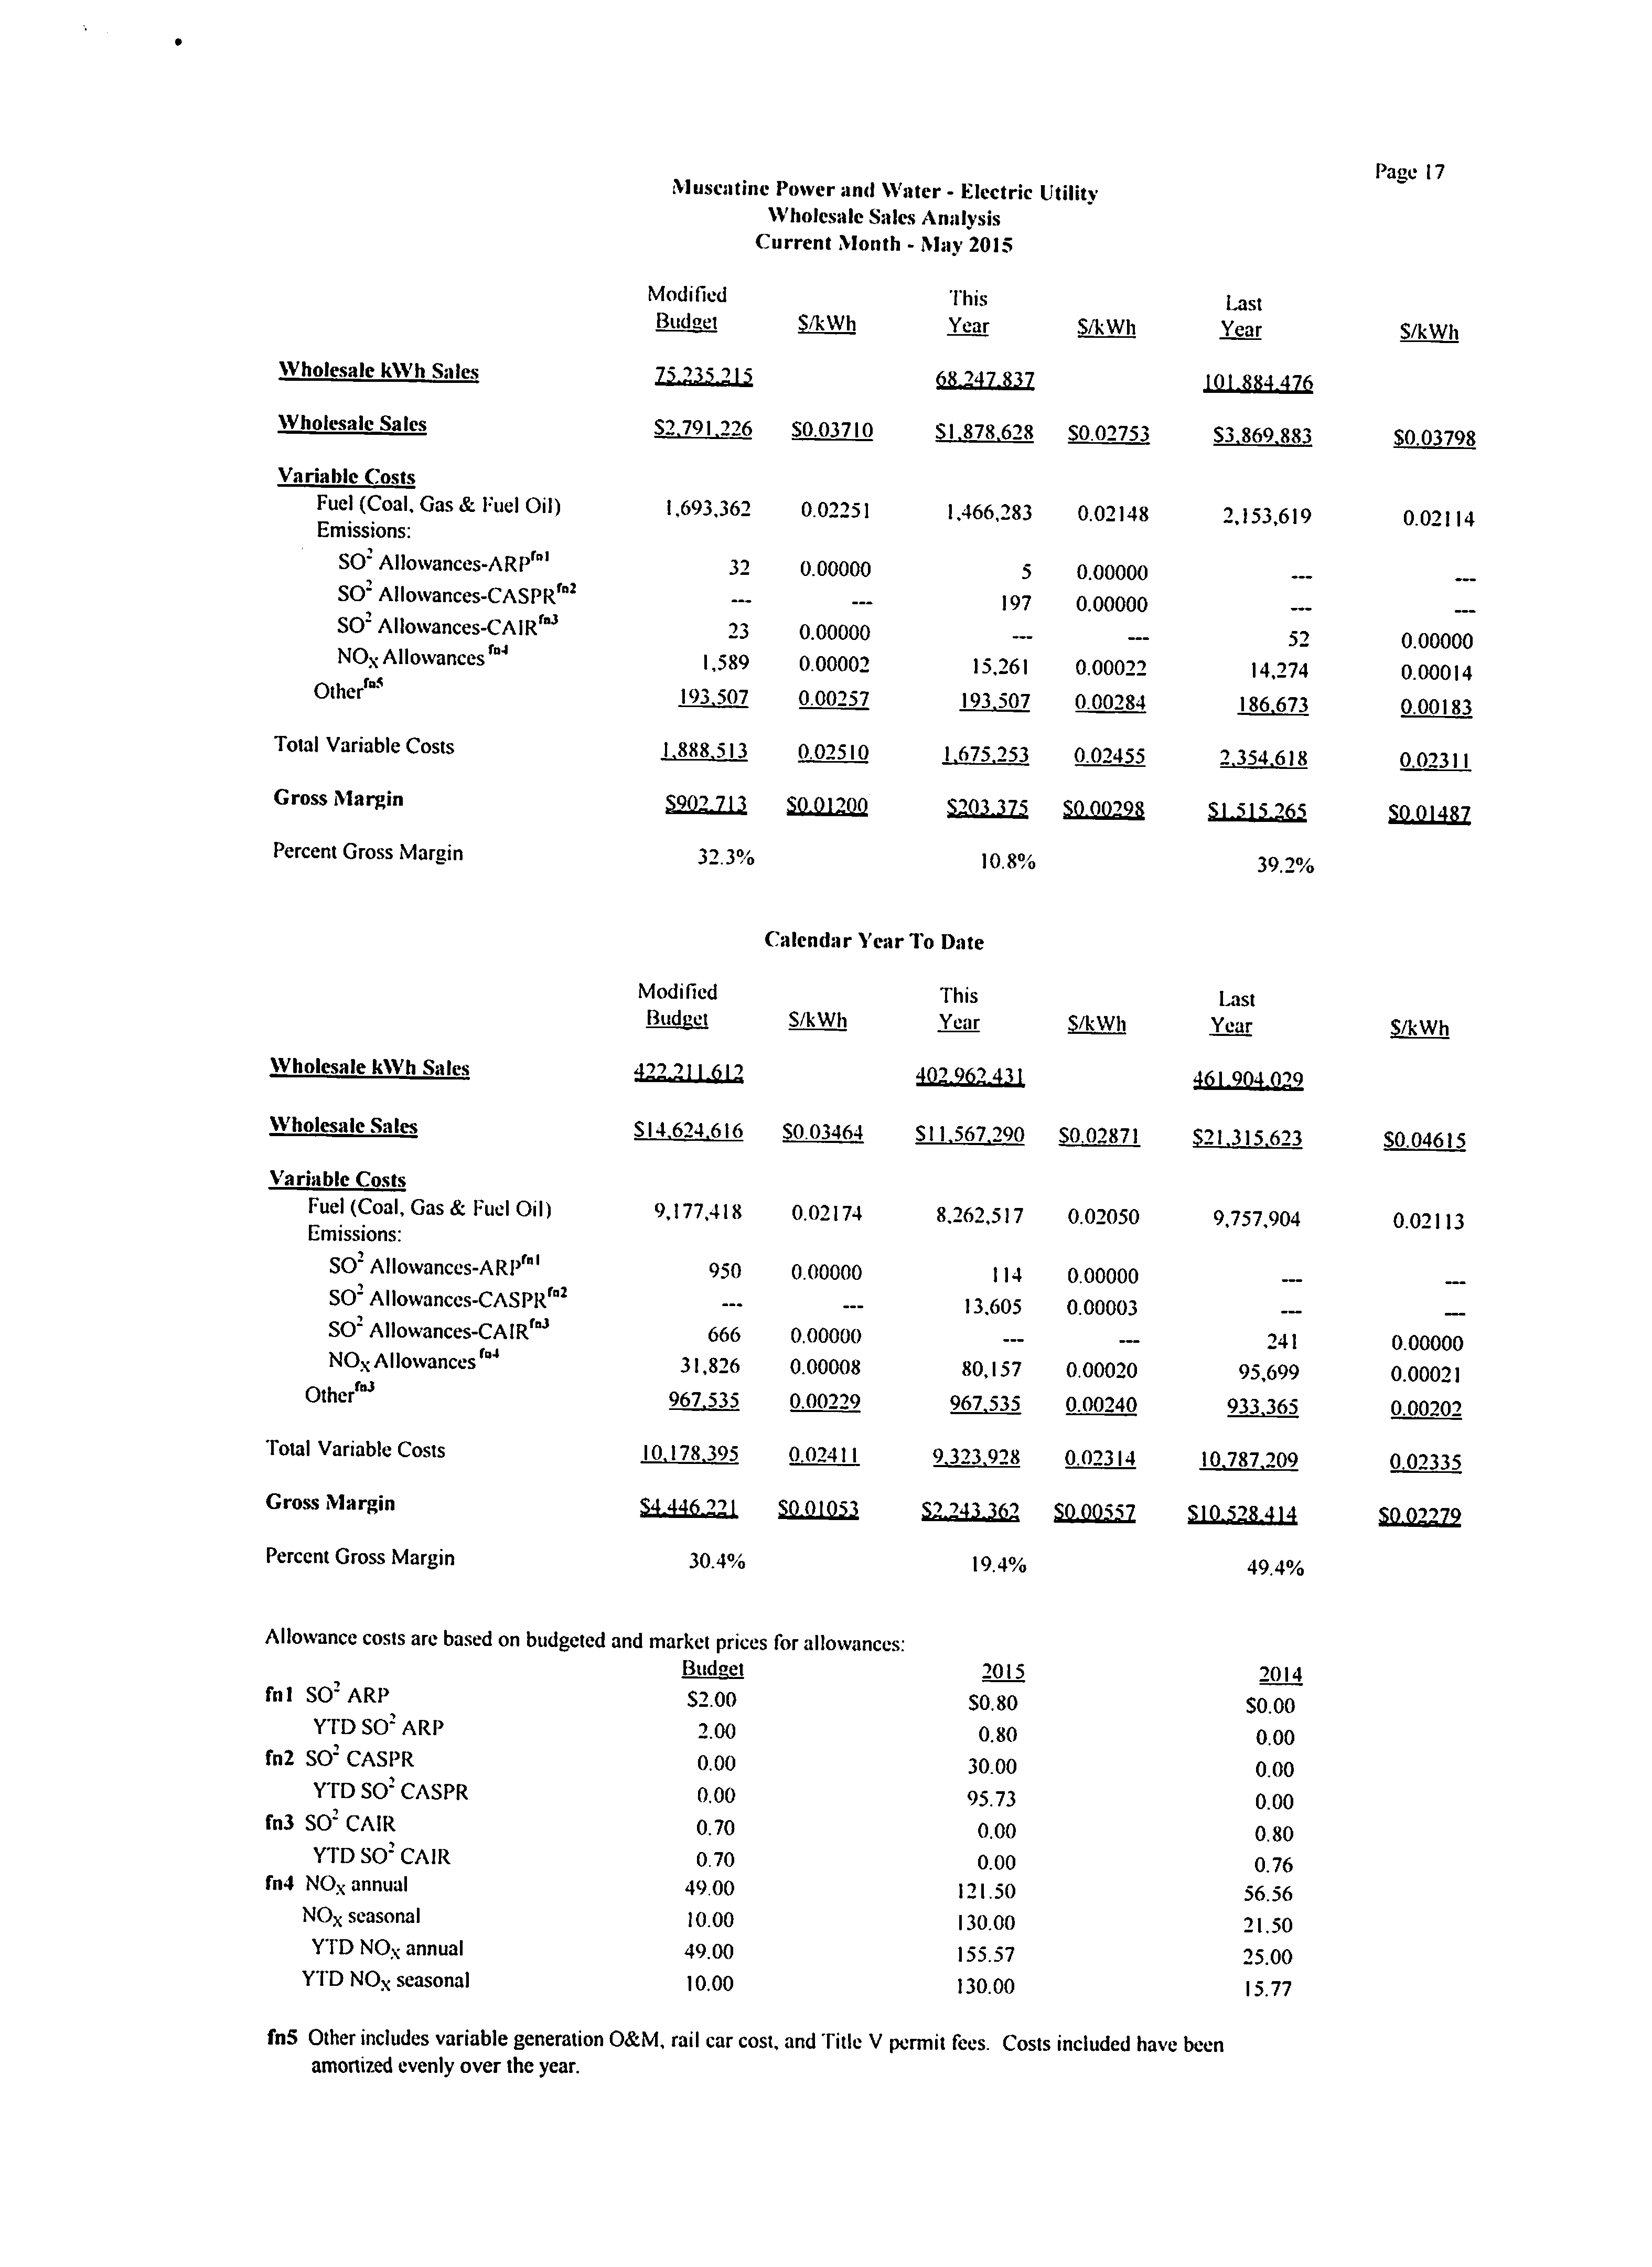
Wholesale Sales Analysis
17
Page 1
Muscatine Power and Water- Electric Utility-
Classification of Electric Energy/Steam Sales
Current Month - May 2015
%
Increase
%
Increase
Budget
(Decrease)
This
(Decrease)
Last
Estimate
From Budget
Year
Fr. Last Yr.
Year
KWH Generated and Sold
Gross Generation
82,797.677
(7.8)
76,363,326
(32.4)
113,035,371
Less: Plant Use
7,562.462
7.3
8,115,489
(27.2)
11,150,895
Net Generation/Wholesale Sales
75,235.215
(9.3)
68,247,837
(33.0)
101,884.476
Net Capacity Factors
Unit 9
58.00
(3.2)
56.15
(18.7)
69.07
Unit 8/8A
5.92
(86.5)
0.80
(98.5)
51.83
Unit 7
20.00
-I.0X
—
-1.0X
11.03
Total Plant
44.01
(9.6)
39.77
(33.3)
59.59
KWH Distribution
Residential
7,017,500
(10.8)
6,262,930
(9.1)
6,886,933
Commercial 1
2.587,000
0.6
2,602,540
(4.2)
2,716,377
Commercial II
6,657,000
42.3
9,475,200
13.3
8,366,480
Industrial I
9.901,472
(4.2)
9,481,500
1.3
9,358,700
Industrial II
38,400.000
1.3
38,917,572
(L4)
39,462,284
City Enterprise Funds
482.792
(4.7)
460,261
19.6
384,679
Water & Communications Utilities
1,374,962
9.5
1,506,090
7.5
1,400,928
Native System Sales
66,420,726
3.4
68,706.093
0.2
68,576,381
City Lighting
179.000
(9.4)
162.259
(7.3)
174.943
City Buildings
565,000
(18.7)
459.192
(4.2)
479,115
Offline Power Plant Usage
370.595
(1.2)
366,004
61.6
226.440
Losses & Cycle Billing
2.080.446
(3.9)
1,998,351
(35.1)
3,079,597
Total Native System KWH
Distributed/Purchased Power
69.615.767
3.0
71,691,899
(1.2)
72,536,476
STEAM SALES - 1000 lbs
45,694
(84.4)
7.124
(97.0)
234,885
Back to top