Muscatine Power and Water
Electric Utility
Operating Statements and Balance Sheets
June 2012
Muscatine Power and Water
Electric Utility
Table of Contents
Page
Classification of Electric Energy Distribution
1 -2
Statements of Revenues, Expenses, and Changes in Net Assets
3-4
Balance Sheets
5-6
Statements of Cash Flows
7-8
Funds Appropriated for Specific Purposes
9
Summary of Expenses
10-15
Statistical Data
16
Wholesale Sales Analysis
17
Page
1
Muscatine Power and Water - Electric Utility
Classification of Electric Energy/Steam Sales
Current Month - June 2012
%
Increase
%
Increase
Budget
(Decrease)
This
(Decrease)
Last
Estimate
From Budget
Year
Fr. Last Yr.
Year
KWH Generated and Sold
Gross Generation
88,848,720
(24.2)
67,313,872
(23.3)
87,819,048
Less: Plant Use
7,582,320
8.6
8,233,548
(14.9)
9,680,164
Net Generation/Wholesale Sales
81,266,400
(27.3)
59,080,324
(24.4)
78,138,884
Net Capacity
Factors
Unit 9
65.00
(39.0)
39.66
(22.9)
51.45
Unit 8/8A
—
—
34.07
(26.8)
46.54
Unit 7
30.00
(62.1)
11.37
(27.6)
15.71
Total Plant
49.03
(27.3)
35.65
(24.2)
47.01
KWH Distribution
Residential
8,472,983
17.8
9,982,665
7.4
9,298,808
Commercial I
3,350,996
4.0
3,486,361
5.5
3,306,002
Commercial II
8,841,616
(3.5)
8,535,139
(1.0)
8,617,996
Industrial I
10,503,360
1.8
10,688,840
(3.6)
11,090,600
Industrial II
34,743,362
3.4
35,912,819
(2.1)
36,700,368
City Enterprise Funds
466,708
(27.6)
337,765
(19.1)
417,738
Water & Communications Utilities
1,331,685
(7.9)
1,226,387
(3.9)
1,275,891
Native System Sales
67,710,710
3.6
70,169,976
(0.8)
70,707,403
City Lighting
180,173
(1.2)
177,949
11.0
160,293
City Buildings
545,847
16.3
634,794
12.7
563,170
Offline Power Plant Usage
—
—
582,354
89.4
307,404
Losses & Cycle Billing
3,600,455
(11.2)
3,197,251
(31.0)
4,636,614
Total Native System KWH
Distributed/Purchased Power
72,037,185
3.8
74,762,324
(2.1)
76,374,884
STEAM
SALES
-
1000 lbs
252,433
21.6
207,598
Muscatine Power and Water - Electric Utility
Classification of Electric Energy/Steam Sales
Calendar Year-to-Date - June 2012
Page 2
%
Increase
%
Increase
Budget
(Decrease)
This
(Decrease)
Last
Estimate
From Budeet
Year
Fr. Last Yr.
Year
KWH Generated and Sold
Gross Generation
557,380,839
(49.4)
281,914,673
(25.7)
379,326,297
Less: Plant Use
53,556,615
(26.6)
39,314,206
(2.6)
40,374,472
Net Generation/Wholesale Sales
503,824,224
(51.8)
242,600,467
(28.4)
338,951,825
Net Capacity
Factors
Unit 9
62.18
(57.6)
26.36
(13.9)
30.60
Unit 8/8A
16.27
61.2
26.22
(43.4)
46.31
Unit 7
29.67
(82.7)
5.14
(84.3)
32.68
Total Plant
50.11
(51.9)
24.12
(28.6)
33.79
KWH
Distribution
Residential
46,648,717
3.0
48,039,818
(3.1)
49,552,989
Commercial I
18,481,136
(1.6)
18,183,912
(2.9)
18,718,619
Commercial II
50,090,293
(2.9)
48,636,753
(1.7)
49,486,789
Industrial I
55,424,104
„
55,431,560
(4.2)
57,848,240
Industrial II
220,172,072
3.0
226,856,753
1.4
223,814,097
City EnterpriseFunds
2,957,341
(25.3)
2,208,297
(22.5)
2,848,156
Water & Communications Utilities
7,904,067
(8.8)
7,207,542
(2.2)
7,368,756
Native System Sales
401,677,730
1.2
406,564,635
(0.8)
409,637,646
City Lighting
1,023,817
(0.9)
1,014,537
4.6
970,203
CityBuildings
3,187,059
...
3,187,614
(4.1)
3,322,925
OfflinePower Plant Usage
638,400
...
3,591,962
(17.3)
4,342,422
Losses & Cycle Billing
13,375,152
(5.2)
12,673,045
3.0
12,305,236
Total Native System KWH
Distributed/Purchased Power
419,902,158
1.7
427,031,793
(0.8)
430,578,432
STEAM SALES -1000 lbs
736,254
76.4
1,298,627
(0.8)
1,309,721
Page3
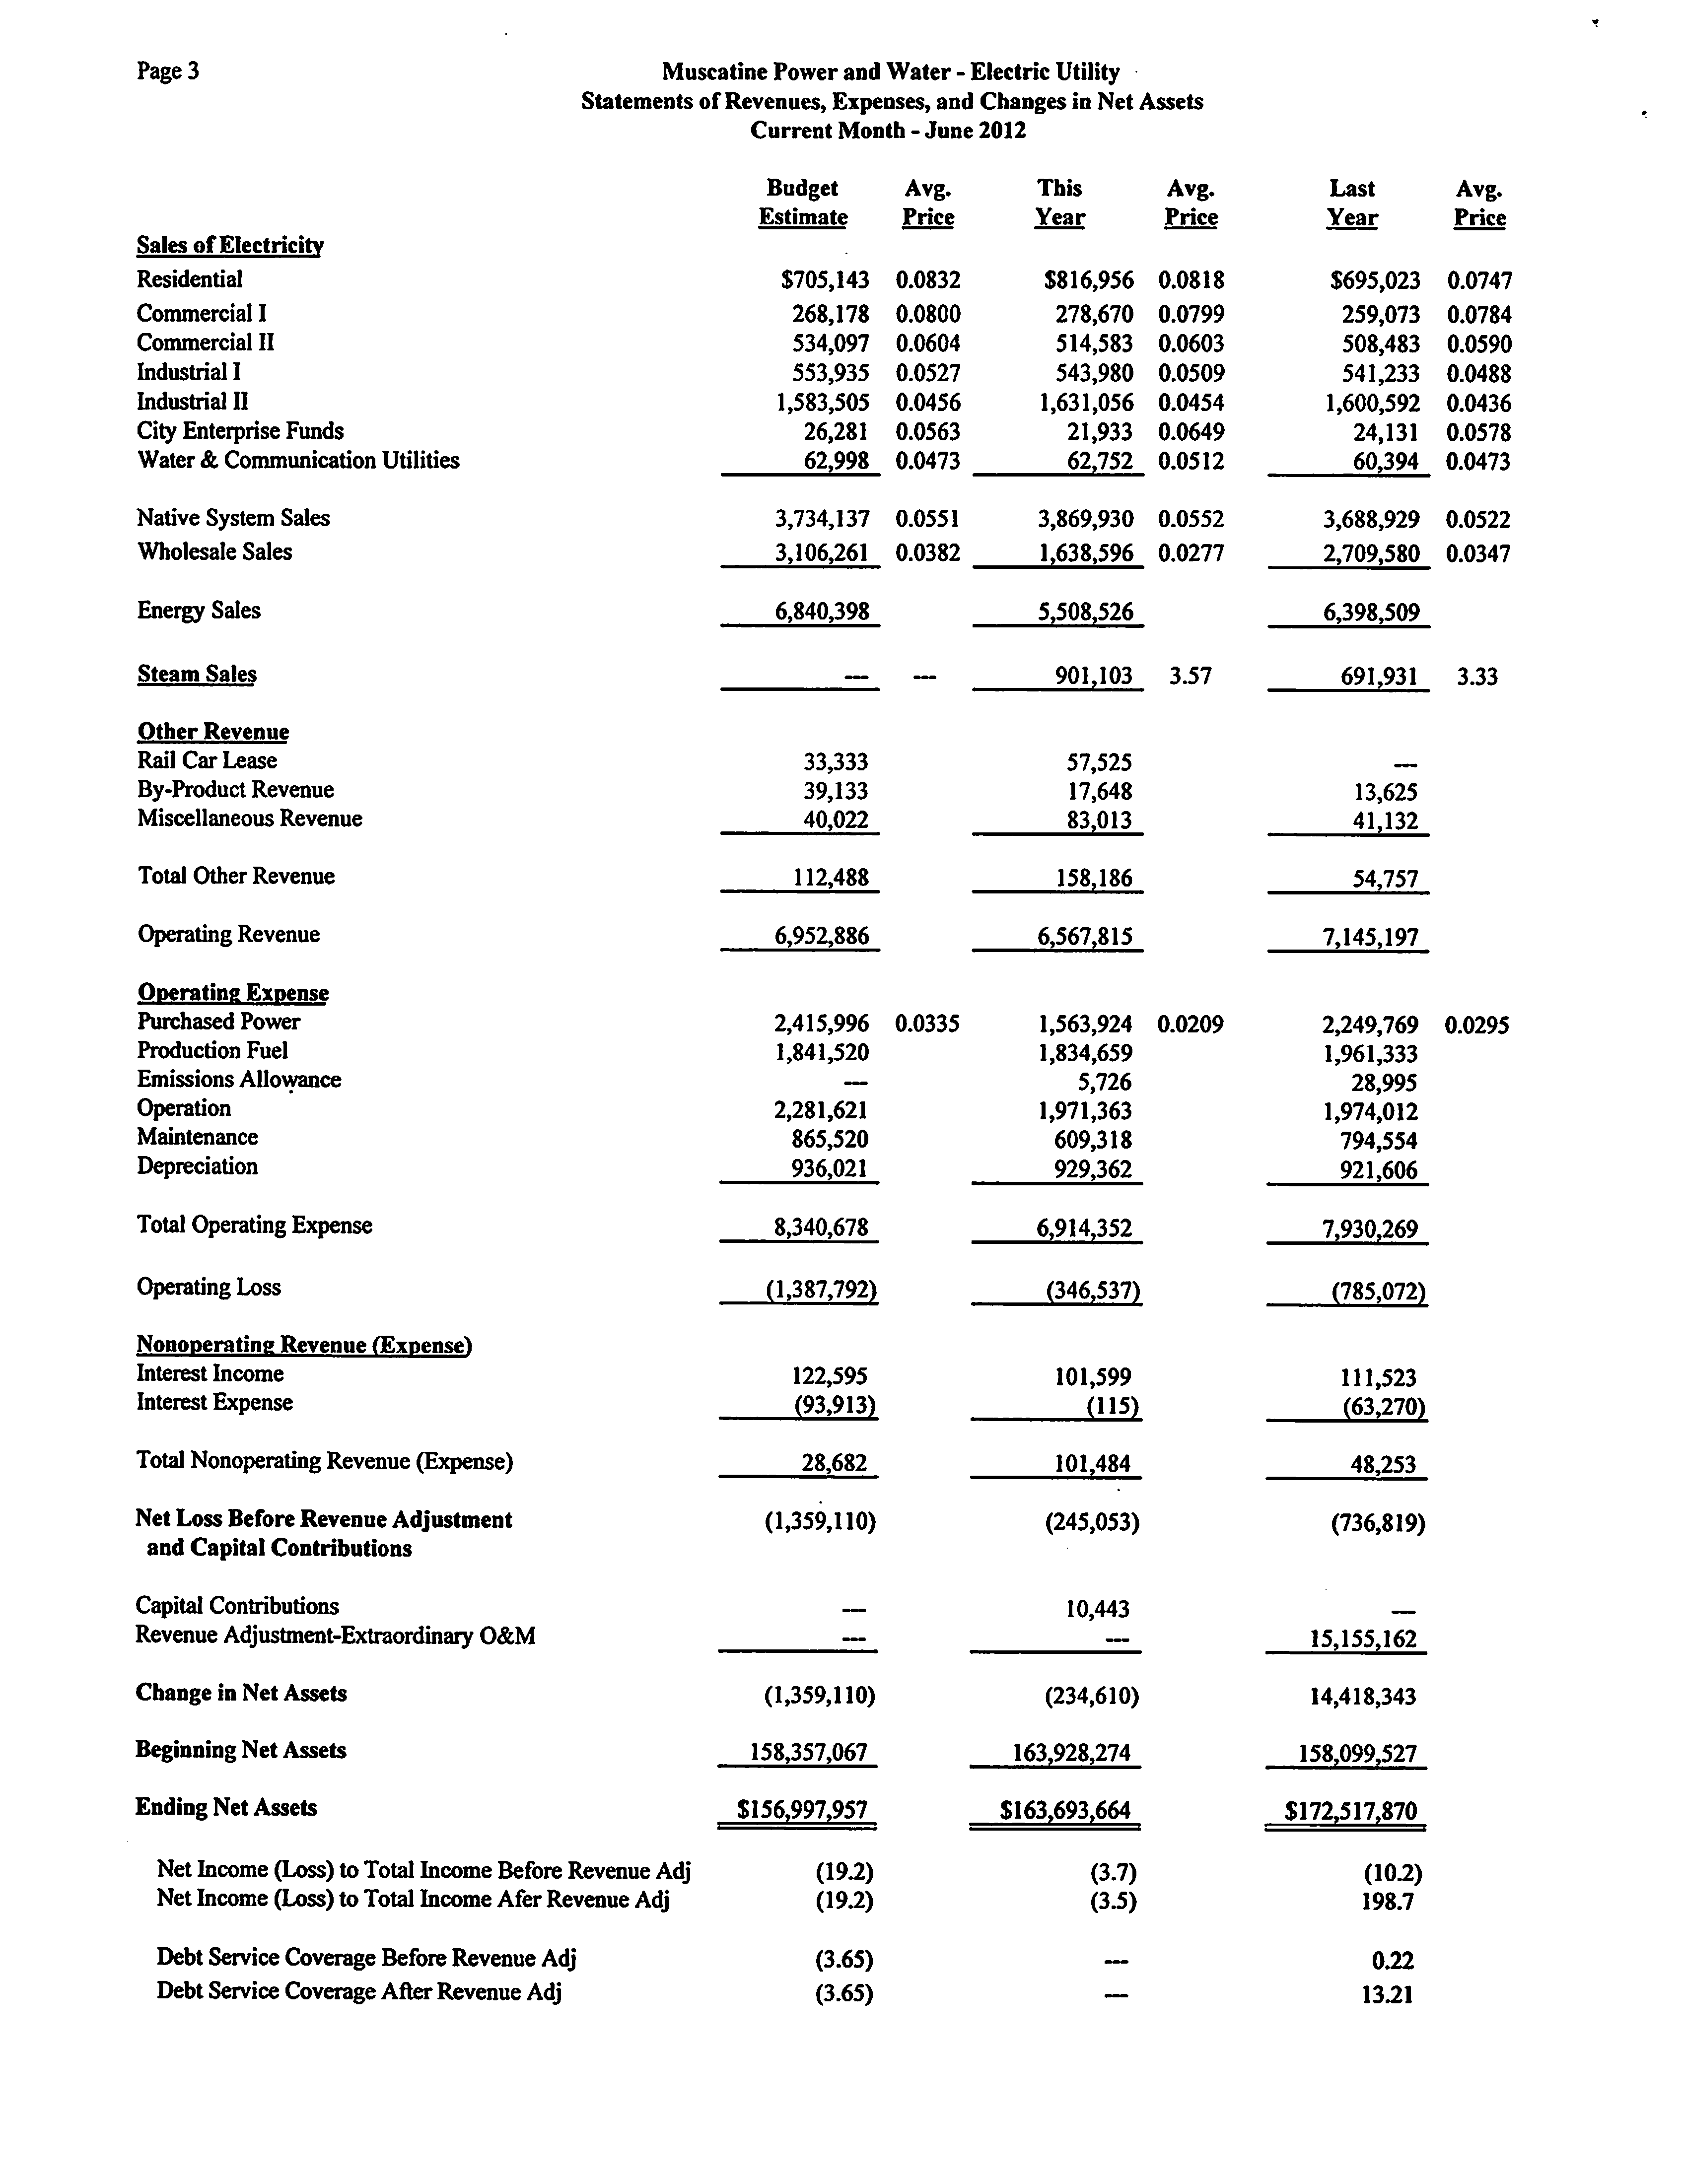
Muscatine Power and Water - Electric Utility
Statements of Revenues, Expenses, and Changes in Net Assets
Current Month - June 2012
Sales of Electricity
Residential
Commercial I
Commercial II
Industrial I
Industrial II
City Enterprise Funds
Water & Communication Utilities
Native System Sales
Wholesale Sales
Energy Sales
Steam Sales
Other Revenue
Rail Car Lease
By-Product Revenue
Miscellaneous Revenue
Total Other Revenue
Operating Revenue
Operating Expense
Purchased Power
Production Fuel
Emissions Allowance
Operation
Maintenance
Depreciation
Total OperatingExpense
Operating Loss
Nonoperating Revenue (Expense)
Interest Income
Interest Expense
Total Nonoperating Revenue (Expense)
Net Loss Before Revenue Adjustment
and Capital Contributions
Capital Contributions
Revenue Adjustment-Extraordinary O&M
Change in Net Assets
Beginning Net Assets
Ending Net Assets
Net Income (Loss) to Total Income Before Revenue Adj
Net Income (Loss) to Total Income Afer Revenue Adj
Debt Service Coverage Before Revenue Adj
Debt Service Coverage After Revenue Adj
Budget
Avg.
This
Avg.
Last
Avg.
Estimate
Price
Year
Price
Year
Price
$705,143 0.0832
$816,956 0.0818
$695,023 0.0747
268,178 0.0800
278,670 0.0799
259,073 0.0784
534,097
0.0604
514,583 0.0603
508,483 0.0590
553,935
0.0527
543,980
0.0509
541,233
0.0488
1,583,505 0.0456
1,631,056 0.0454
1,600,592 0.0436
26,281
0.0563
21,933 0.0649
24,131
0.0578
62,998
0.0473
62,752
0.0512
60,394
0.0473
3,734,137 0.0551
3,869,930 0.0552
3,688,929 0.0522
3,106,261 0.0382
1,638,596 0.0277
2,709,580 0.0347
6,840,398
5,508,526
6,398,509
_
"""
901,103
57,525
3.57
691,931
3.33
33,333
39,133
17,648
13,625
40,022
83,013
41,132
112,488
158,186
54,757
6,952,886
6,567,815
7,145,197
2,415,996
0.0335
1,563,924
0.0209
2,249,769
0.0295
1,841,520
1,834,659
5,726
1,961,333
28,995
2,281,621
1,971,363
1,974,012
865,520
609,318
794,554
936,021
929,362
921,606
8,340,678
6,914,352
7,930,269
(1,387,792)
(346,537)
(785,072)
122,595
101,599
111,523
(93,913)
(115)
(63,270)
28,682
101,484
48,253
(1,359,110)
(245,053)
10,443
(736,819)
15,155,162
14,418,343
(1,359,110)
(234,610)
158,357,067
163,928,274
158,099,527
$156,997,957
$163,693,664
$172,517,870
(19.2)
(3.7)
(102)
(19.2)
(3.5)
198.7
(3.65)
—
0.22
(3.65)
—
1321
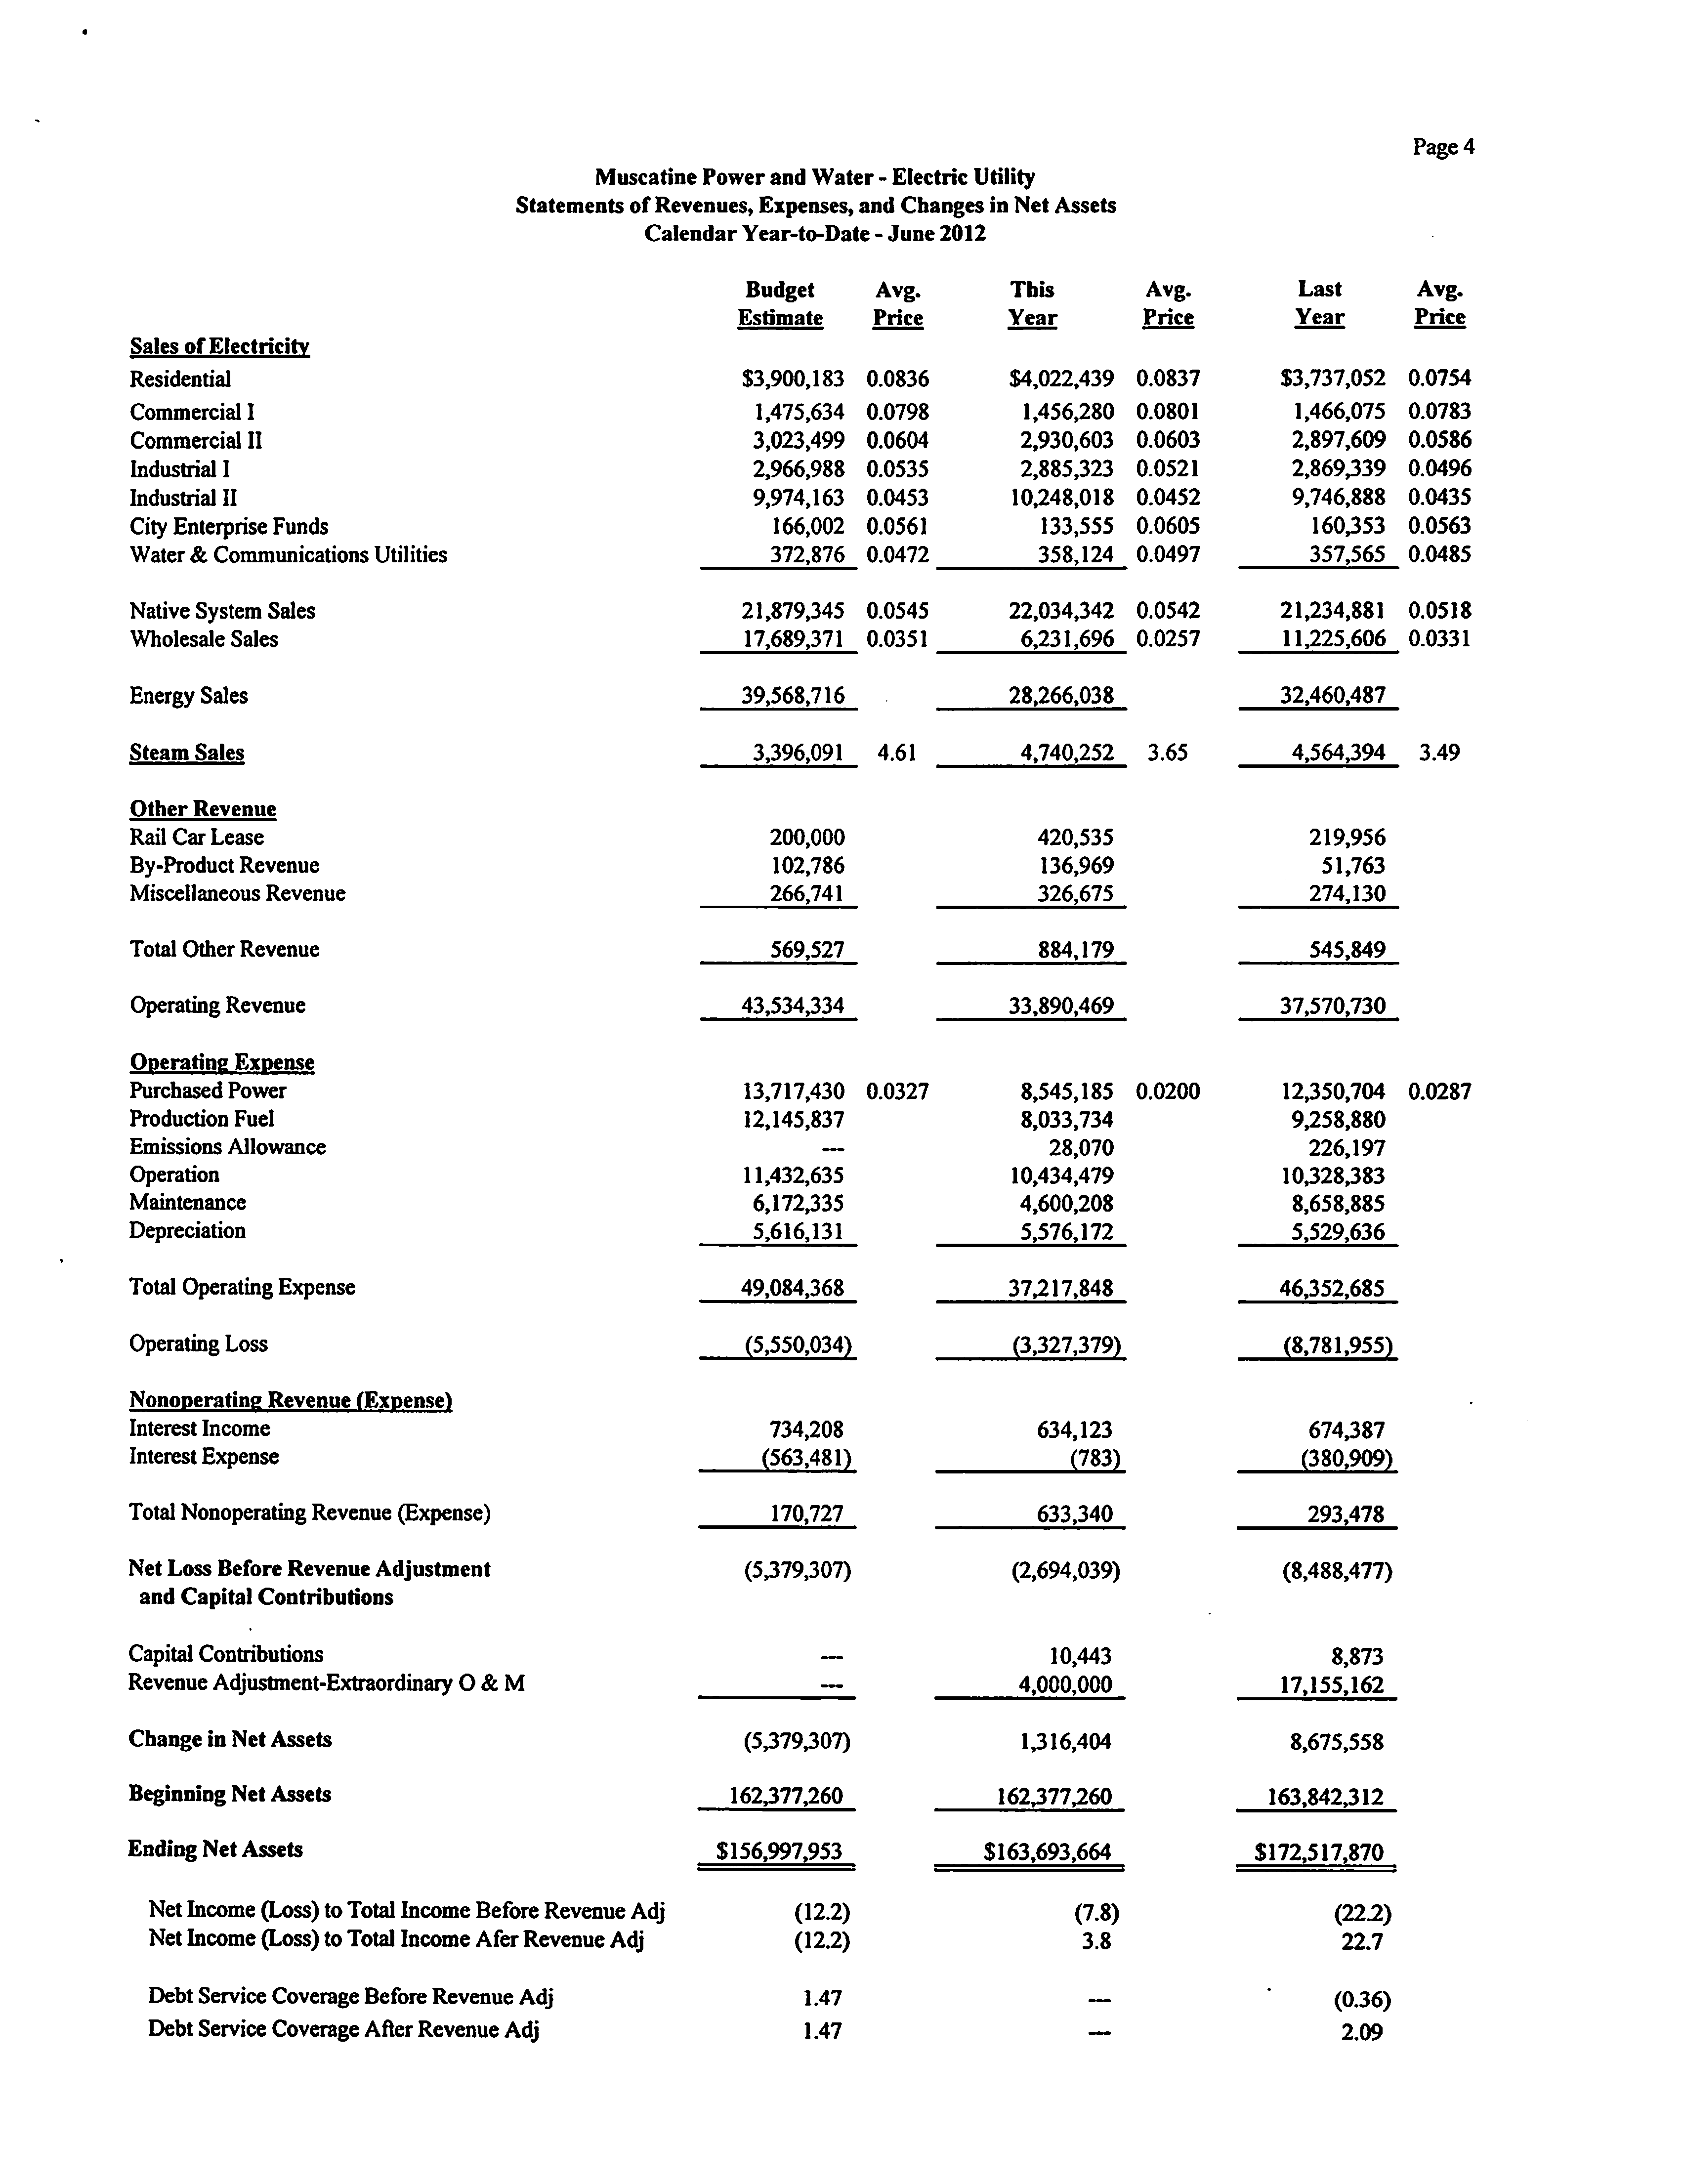
Page 4
Muscatine
Power and Water - Electric Utility
Statements of Revenues, Expenses, and Changes in Net Assets
Calendar Year-to-Date - June 2012
Sales of Electricity
Residential
Commercial I
Commercial II
Industrial I
Industrial II
City Enterprise Funds
Water & Communications Utilities
Native System Sales
Wholesale Sales
Energy Sales
Steam Sales
Other Revenue
Rail Car Lease
By-Product Revenue
Miscellaneous Revenue
Total Other Revenue
Operating Revenue
Operating Expense
Purchased Power
Production Fuel
Emissions Allowance
Operation
Maintenance
Depreciation
Total Operating Expense
Operating Loss
Nonoperating Revenue (Expense)
Interest Income
Interest Expense
Total Nonoperating Revenue (Expense)
Net Loss Before Revenue Adjustment
and Capital Contributions
CapitalContributions
Revenue Adjustment-ExtraordinaryO & M
Change in Net Assets
Beginning Net Assets
Ending Net
Assets
Net Income (Loss) to Total Income Before Revenue Adj
Net Income (Loss) to Total Income Afer Revenue Adj
Debt Service Coverage Before Revenue Adj
Debt Service Coverage After Revenue Adj
Budget
Avg.
This
Avg.
Last
Avg.
Estimate
Price
Year
Price
Year
Price
$3,900,183 0.0836
$4,022,439
0.0837
$3,737,052 0.0754
1,475,634
0.0798
1,456,280 0.0801
1,466,075 0.0783
3,023,499
0.0604
2,930,603
0.0603
2,897,609 0.0586
2,966,988 0.0535
2,885,323
0.0521
2,869339 0.0496
9,974,163 0.0453
10,248,018
0.0452
9,746,888 0.0435
166,002
0.0561
133,555 0.0605
160353 0.0563
372,876
0.0472
358,124 0.0497
357,565 0.0485
21,879,345 0.0545
22,034,342 0.0542
21,234,881 0.0518
17,689,371
0.0351
6,231,696
0.0257
11,225,606
0.0331
39,568,716
28,266,038
32,460,487
3,396,091
4.61
4,740,252
3.65
4,564,394
3.49
200,000
420,535
219,956
102,786
136,969
51,763
266,741
326,675
274,130
569,527
884,179
545,849
43,534^34
33,890,469
37,570,730
13,717,430
0.0327
8,545,185 0.0200
12350,704
0.0287
12,145,837
8,033,734
28,070
9,258,880
226,197
11,432,635
10,434,479
10328,383
6,172^35
4,600,208
8,658,885
5,616,131
5,576,172
5,529,636
49,084,368
37,217,848
46,352,685
(5,550,034)
(3,327,379)
(8,781,955)
734,208
634,123
674387
(563,481)
(783)
(380,909)
170,727
633,340
293,478
(5,379,307)
(2,694,039)
10,443
4,000,000
1316,404
(8,488,477)
8,873
17,155,162
8,675,558
(5379307)
162,377,260
162,377,260
163,842,312
$156,997,953
$163,693,664
$172,517,870
(12.2)
(7.8)
(22.2)
(12.2)
3.8
22.7
1.47
—
(0.36)
1.47
—
2.09
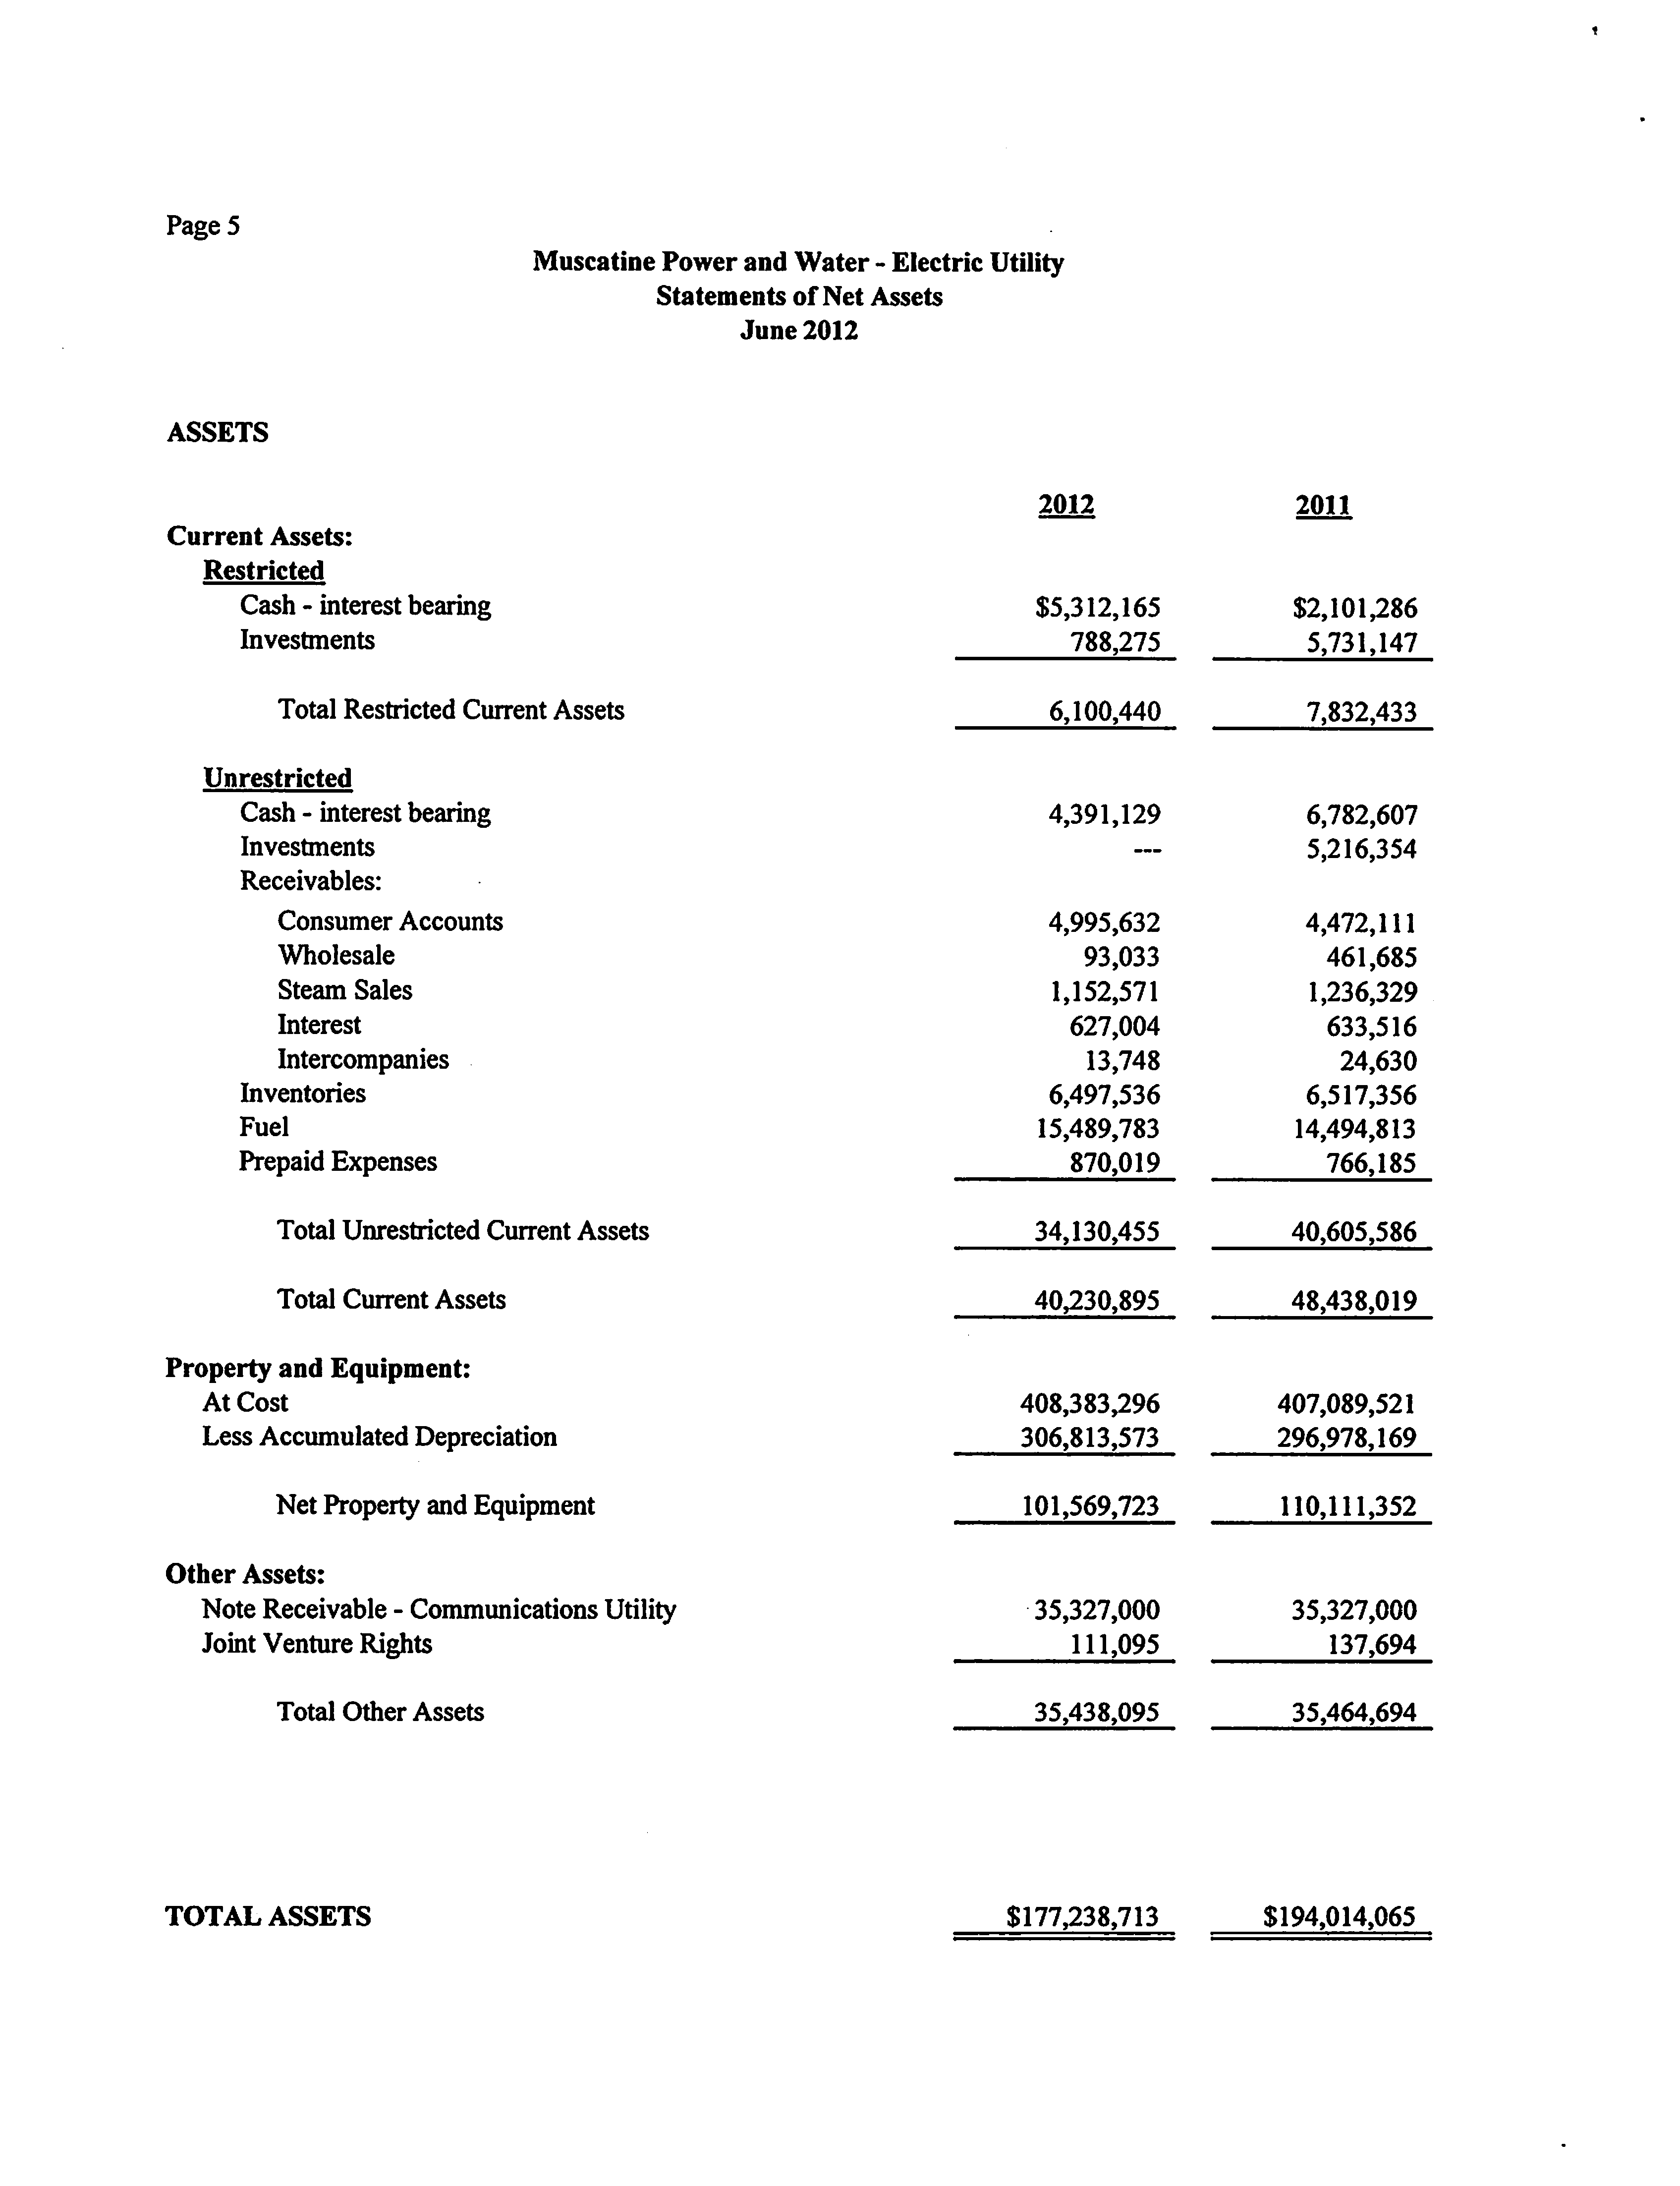
Page 5
Muscatine Power and Water - Electric Utility
Statements of Net Assets
June 2012
ASSETS
Current Assets:
Restricted
Cash - interest bearing
Investments
Total Restricted Current Assets
Unrestricted
Cash - interest bearing
Investments
Receivables:
Consumer Accounts
Wholesale
Steam Sales
Interest
Intercompanies
Inventories
Fuel
Prepaid Expenses
Total Unrestricted Current Assets
Total Current Assets
Property and Equipment:
At Cost
Less Accumulated Depreciation
Net Property and Equipment
Other Assets:
Note Receivable - Communications Utility
Joint Venture Rights
Total Other Assets
TOTAL ASSETS
2012
$5,312,165
788,275
6,100,440
2011
$2,101,286
5,731,147
7,832,433
4,391,129
6,782,607
—
5,216,354
4,995,632
4,472,111
93,033
461,685
1,152,571
1,236,329
627,004
633,516
13,748
24,630
6,497,536
6,517,356
15,489,783
14,494,813
870,019
766,185
34,130,455
40,230,895
408,383,296
306,813,573
101,569,723
35,327,000
111,095
35,438,095
$177,238,713
40,605,586
48,438,019
407,089,521
296,978,169
110,111,352
35,327,000
137,694
35,464,694
$194,014,065
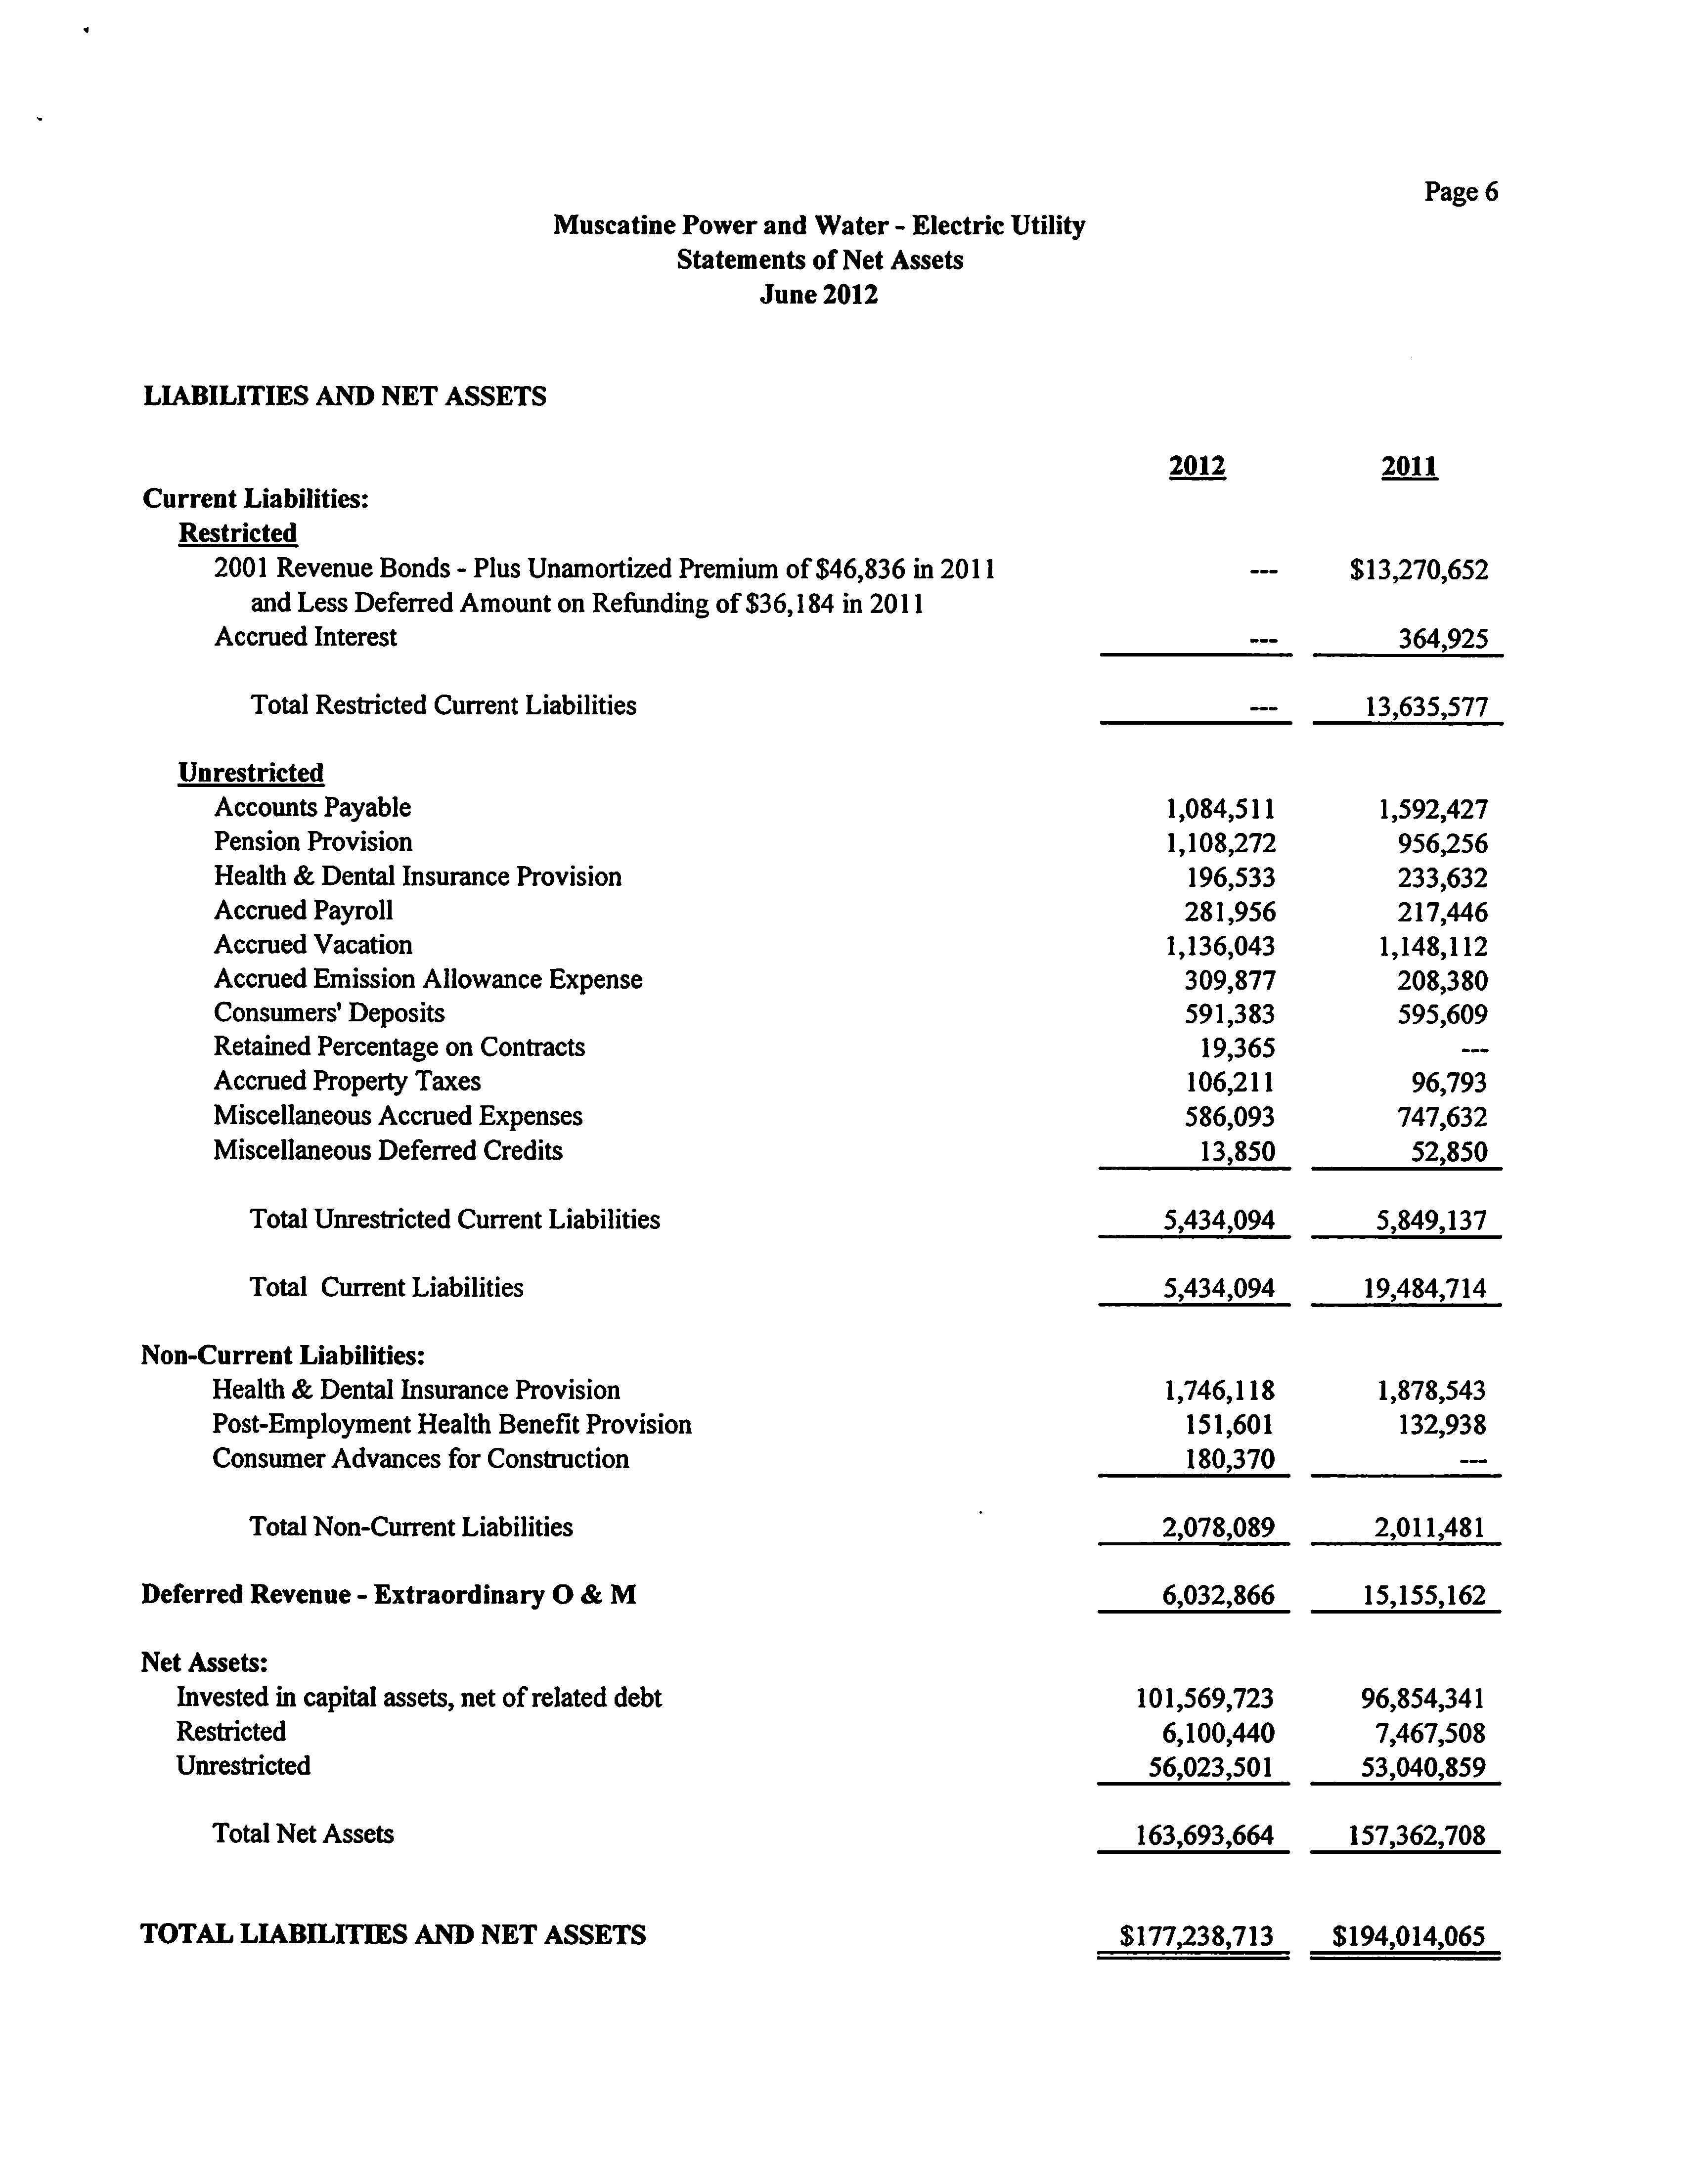
Page 6
Muscatine Power and Water - Electric Utility
Statements of Net Assets
June 2012
LIABILITIES AND NET
ASSETS
Current Liabilities:
Restricted
2001 Revenue Bonds - Plus Unamortized Premium of $46,836 in 2011
and Less Deferred Amount on Refunding of $36,184 in 2011
Accrued Interest
Total Restricted Current Liabilities
Unrestricted
Accounts Payable
Pension Provision
Health & Dental Insurance Provision
Accrued Payroll
Accrued Vacation
Accrued Emission Allowance Expense
Consumers' Deposits
Retained Percentage on Contracts
Accrued Property Taxes
Miscellaneous Accrued Expenses
Miscellaneous Deferred Credits
Total Unrestricted Current Liabilities
Total Current Liabilities
Non-Current Liabilities:
Health & Dental Insurance Provision
Post-Employment Health Benefit Provision
Consumer Advances for Construction
Total Non-Current Liabilities
Deferred Revenue - Extraordinary O
&
M
Net Assets:
Invested in capital assets, net of related debt
Restricted
Unrestricted
Total Net Assets
TOTAL LIABILITIES AND NET ASSETS
2012
2011
-_-
$13,270,652
364,925
13,635,577
1,084,511
1,592,427
1,108,272
956,256
196,533
233,632
281,956
217,446
1,136,043
1,148,112
309,877
208,380
591,383
595,609
19,365
—
106,211
96,793
586,093
747,632
13,850
52,850
5,434,094
5,849,137
5,434,094
19,484,714
1,746,118
1,878,543
151,601
132,938
180,370
—
2,078,089
2,011,481
6,032,866
15,155,162
101,569,723
96,854,341
6,100,440
7,467,508
56,023,501
53,040,859
163,693,664
157,362,708
$177,238,713
$194,014,065
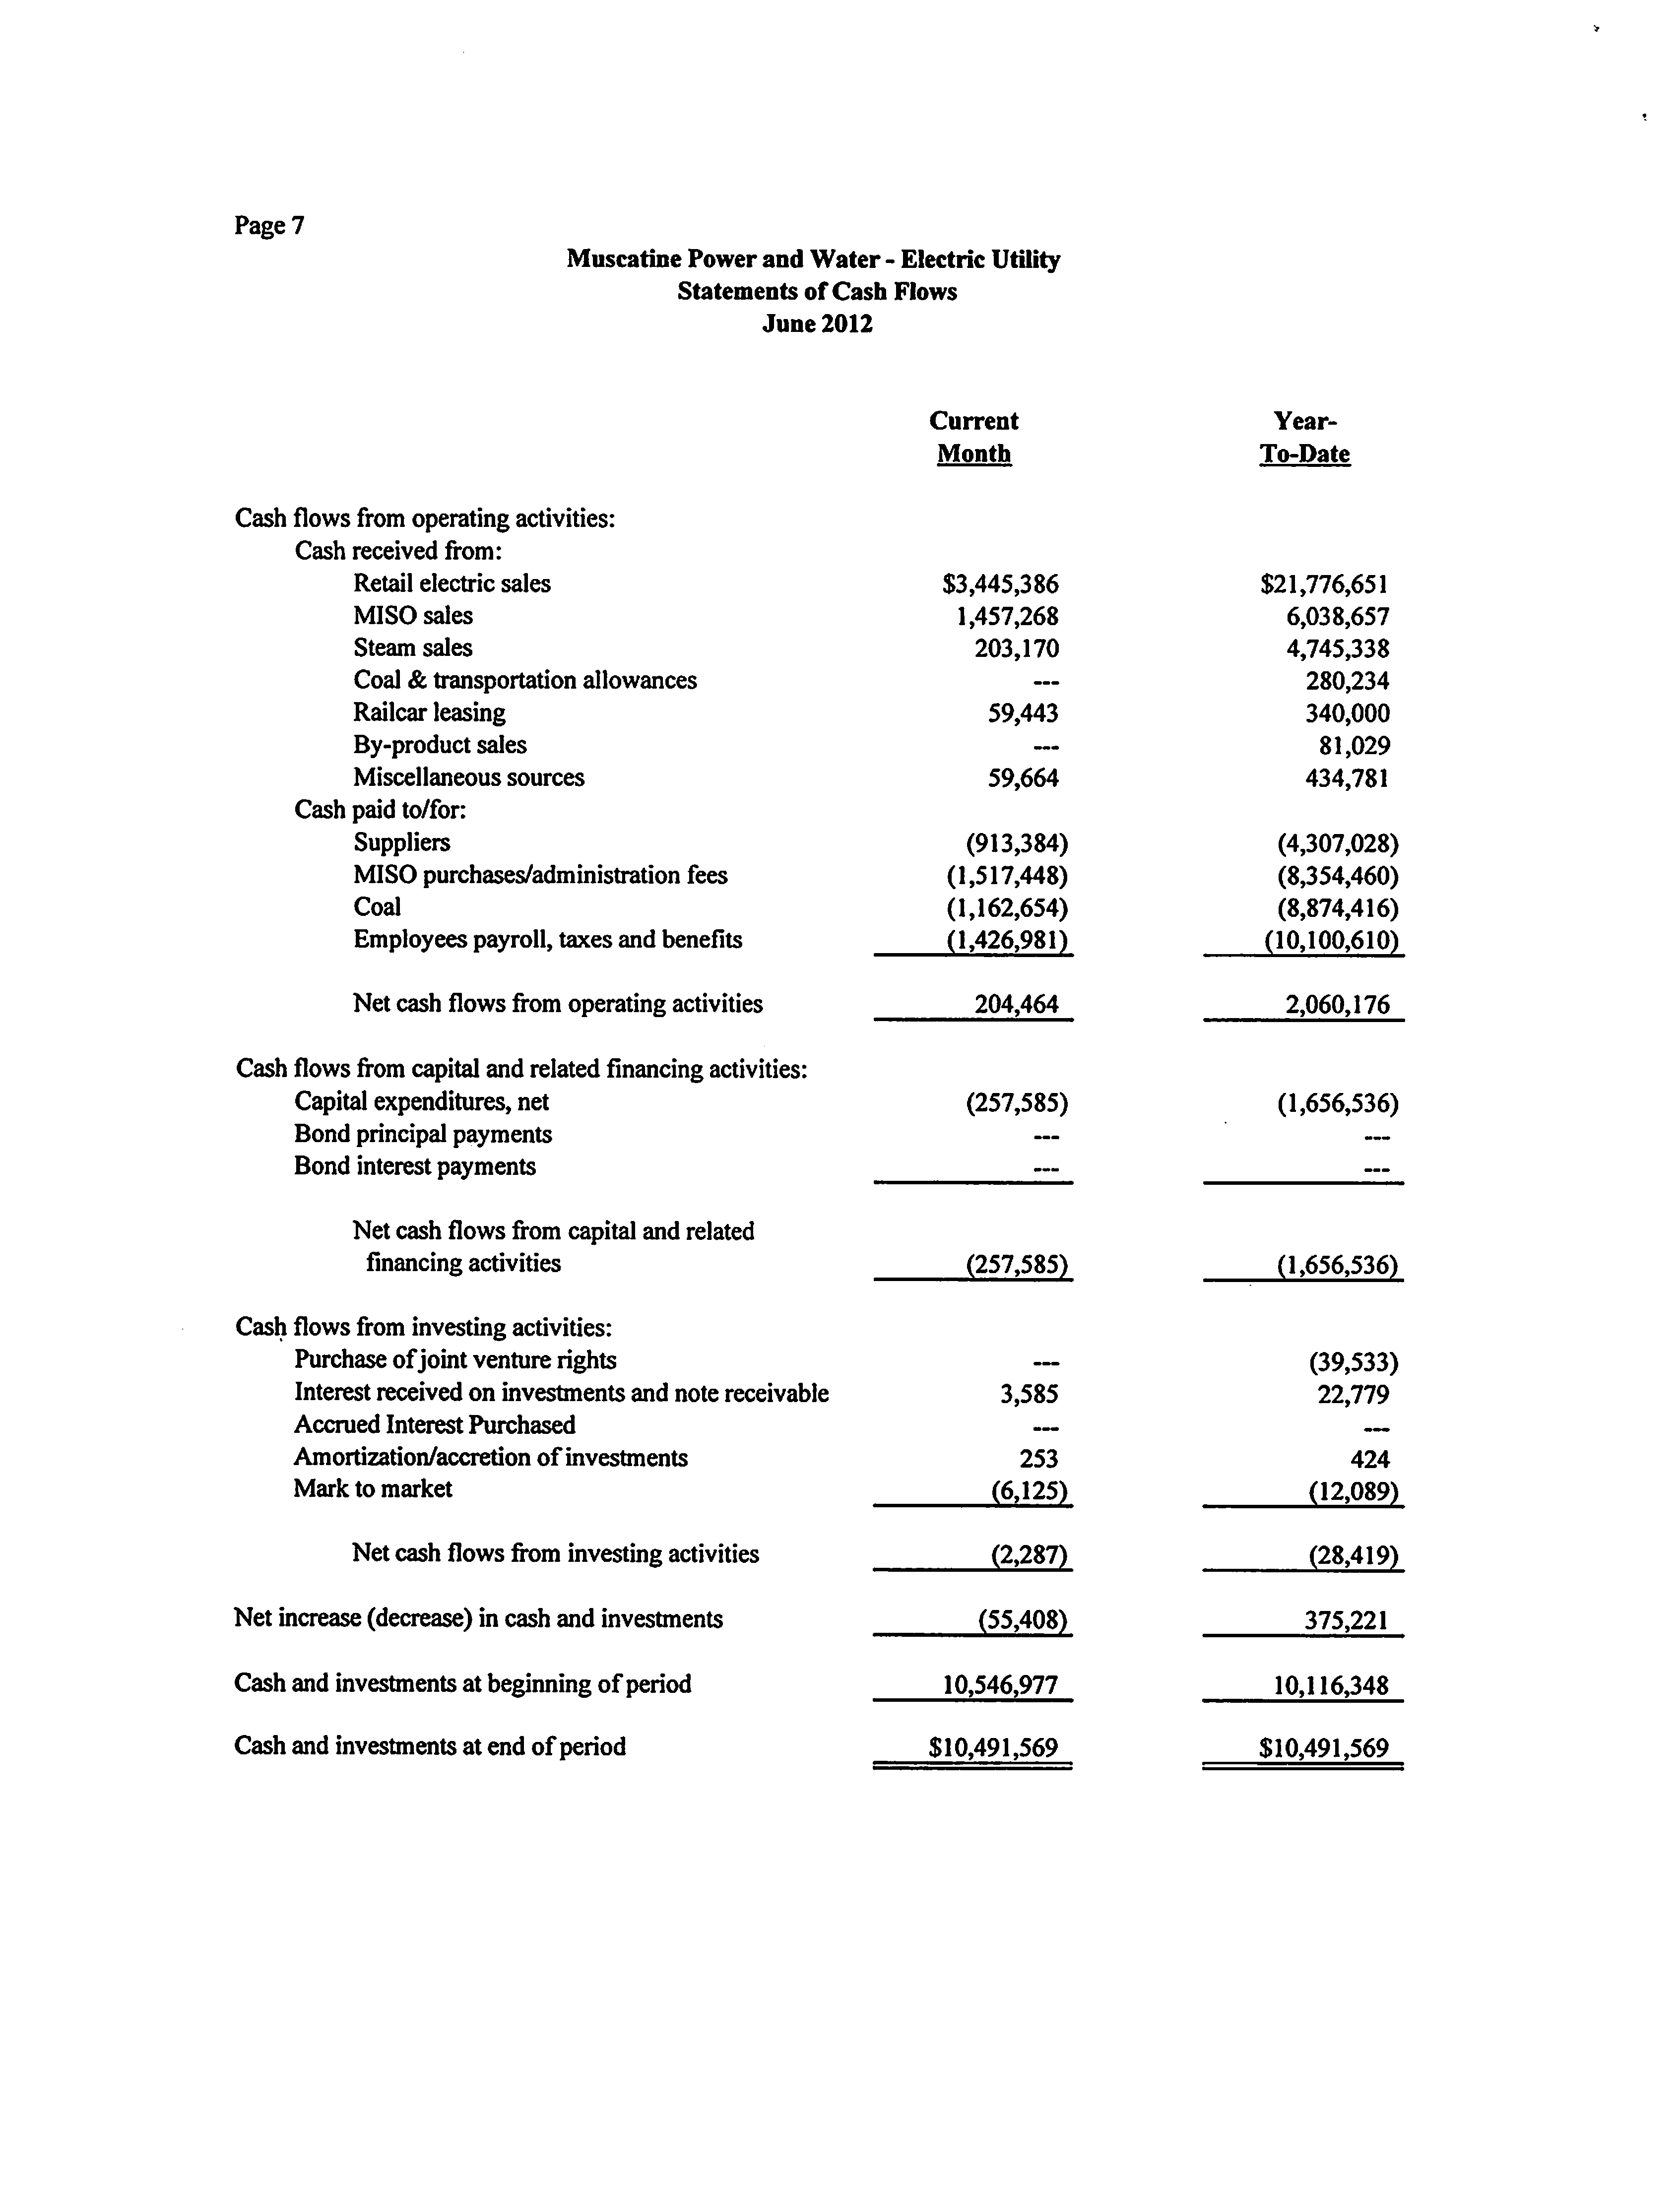
Page 7
Muscatine Power and Water - Electric Utility
Statements of Cash Flows
June 2012
Current
Month
Year-
To-Pate
Cash flows from operating activities:
Cash received from:
Retail electric sales
$3,445,386
$21,776,651
MISO sales
1,457,268
6,038,657
Steam sales
203,170
4,745,338
Coal & transportation allowances
—
280,234
Railcar leasing
59,443
340,000
By-product sales
—
81,029
Miscellaneous sources
59,664
434,781
Cash paid to/for:
Suppliers
(913,384)
(4,307,028)
MISO purchases/administration fees
(1,517,448)
(8,354,460)
Coal
(1,162,654)
(8,874,416)
Employees payroll, taxes and benefits
(1,426,981)
(10,100,610)
Net cash flows from operating activities
204,464
2,060,176
Cash flows from capital and related financing activities:
Capital expenditures, net
Bond principal payments
Bond interest payments
Net cash flows from capital and related
financing activities
Cash flows from investing activities:
Purchase
of joint venture rights
Interest received on investments and note receivable
Accrued Interest Purchased
Amortization/accretion of investments
Mark to market
Net cash flows from investing activities
Net increase (decrease) in cash and investments
Cash and investments at beginning of period
Cash and investments at end
of period
(257,585)
(1,656,536)
(257,585)
(1,656,536)
3,585
(39,533)
22,779
253
(6,125)
424
(12,089)
(2,287)
(28,419)
(55,408)
375,221
10,546,977
10,116,348
$10,491,569
$10,491,569
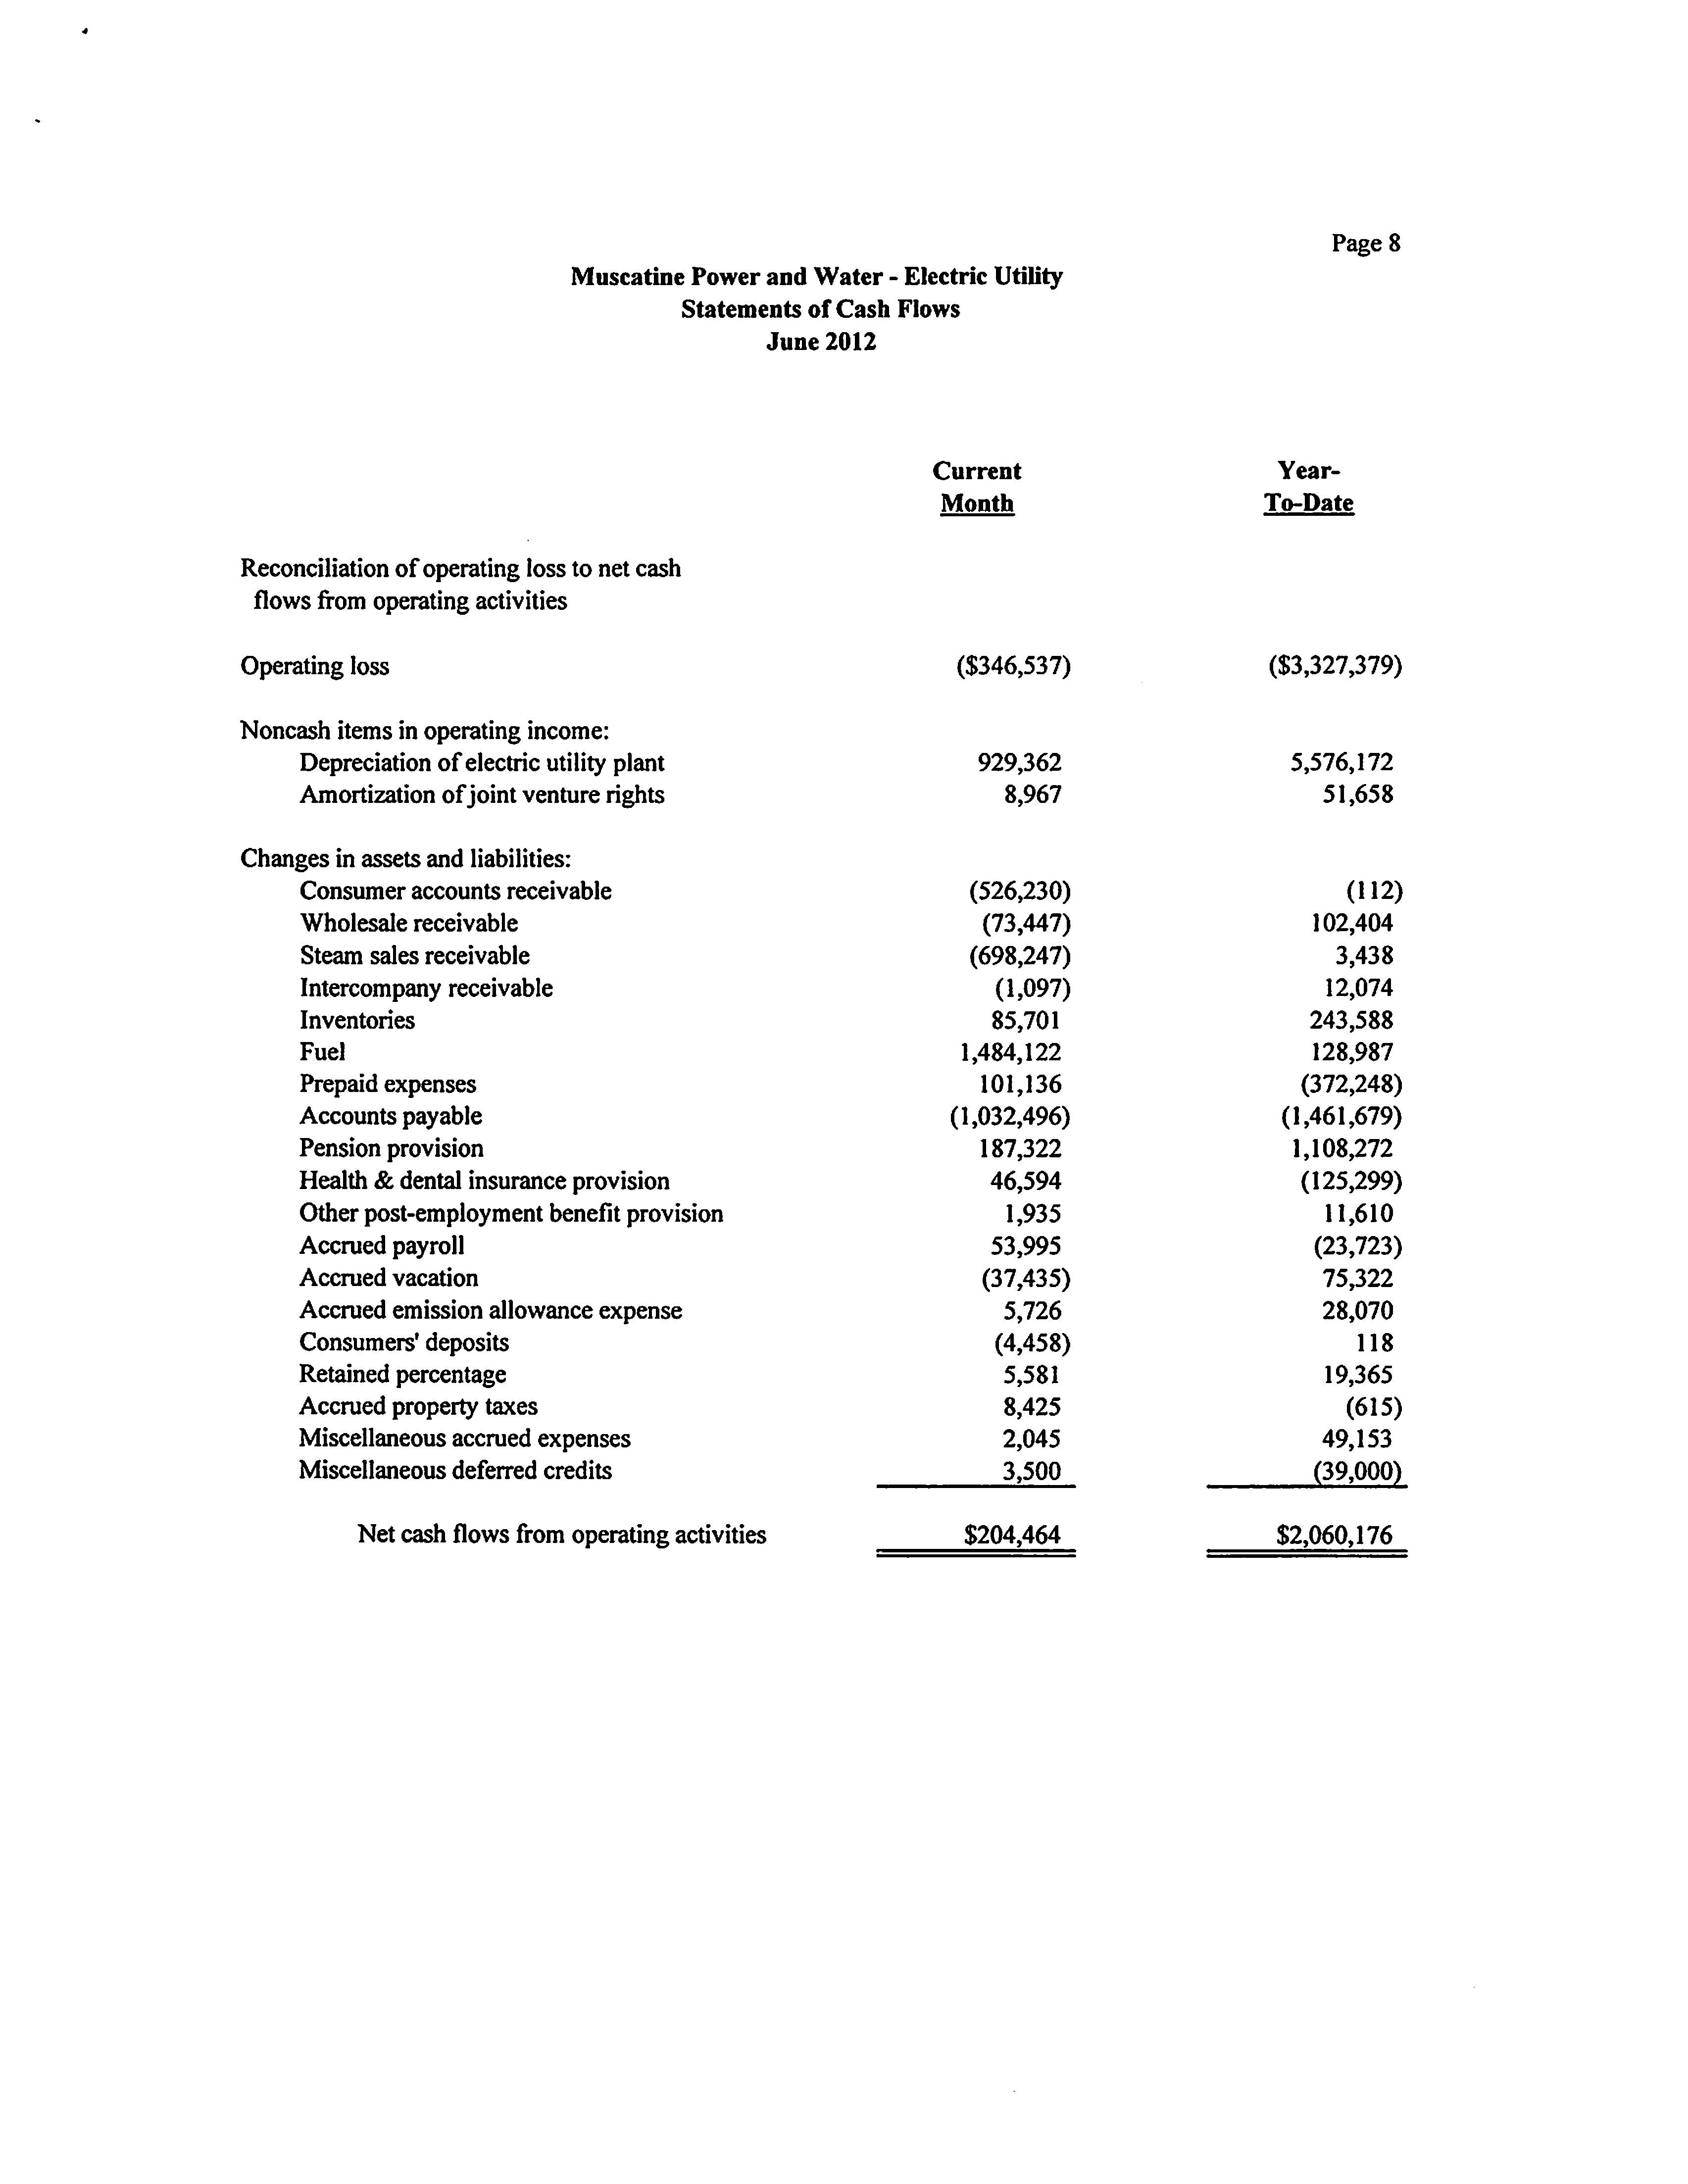
Page 8
Muscatine Power and Water - Electric Utility
Statements of Cash Flows
June 2012
Reconciliation of operating loss to net cash
flows from operating activities
Operating loss
Noncash items in operating income:
Depreciation
of electric utility plant
Amortization
of joint venture rights
Changes in assets and liabilities:
Consumer accounts receivable
Wholesale receivable
Steam sales receivable
Intercompany receivable
Inventories
Fuel
Prepaid expenses
Accounts payable
Pension provision
Health & dental insurance provision
Other post-employment benefit provision
Accrued payroll
Accrued vacation
Accrued emission allowance expense
Consumers' deposits
Retained percentage
Accrued property taxes
Miscellaneous accrued expenses
Miscellaneous deferred credits
Net cash flows from operating activities
Current
Month
Year-
To-Date
($346,537)
($3,327,379)
929,362
5,576,172
8,967
51,658
(526,230)
(112)
(73,447)
102,404
(698,247)
3,438
(1,097)
12,074
85,701
243,588
1,484,122
128,987
101,136
(372,248)
(1,032,496)
(1,461,679)
187,322
1,108,272
46,594
(125,299)
1,935
11,610
53,995
(23,723)
(37,435)
75322
5,726
28,070
(4,458)
118
5,581
19,365
8,425
(615)
2,045
49,153
3,500
(39,000)
$204,464
$2,060,176
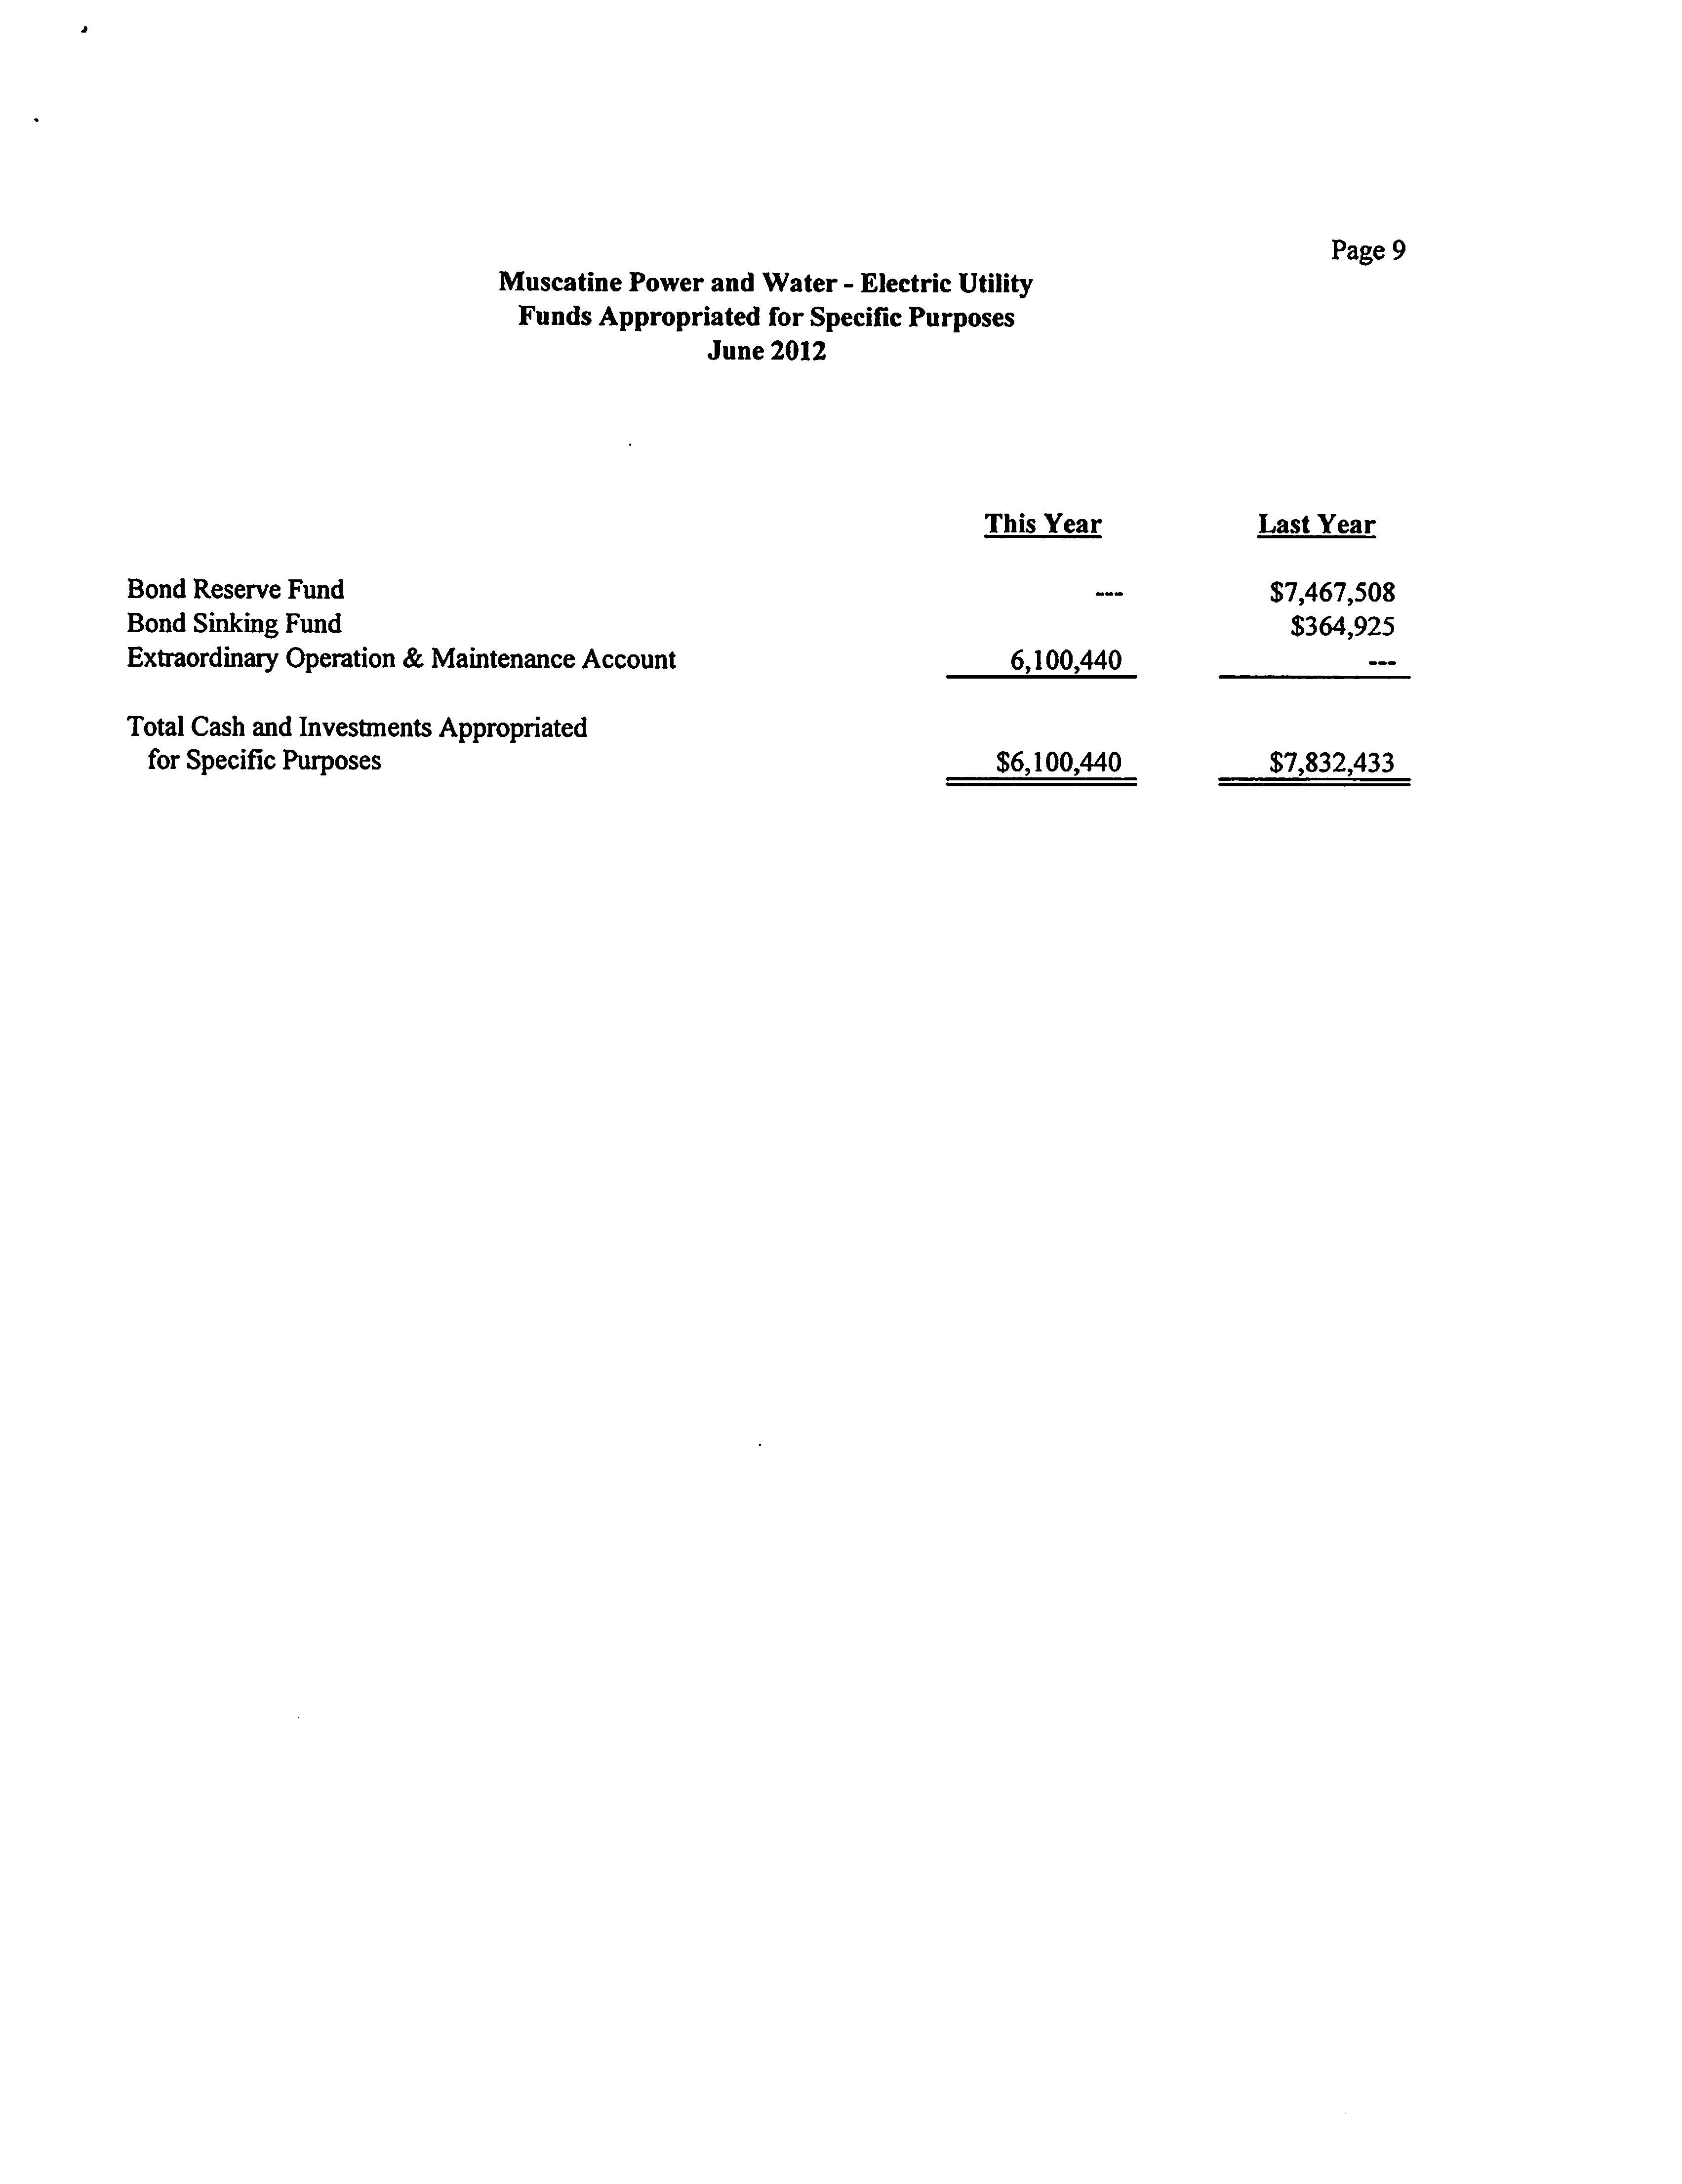
Page 9
Muscatine Power and Water - Electric Utility
Funds Appropriated for Specific Purposes
June 2012
This Year
Last Year
Bond Reserve Fund
—
$7,467,508
Bond Sinking Fund
$364,925
Extraordinary Operation & Maintenance Account
6,100,440
—
Total Cash and Investments Appropriated
for Specific Purposes
$6,100,440
$7,832,433
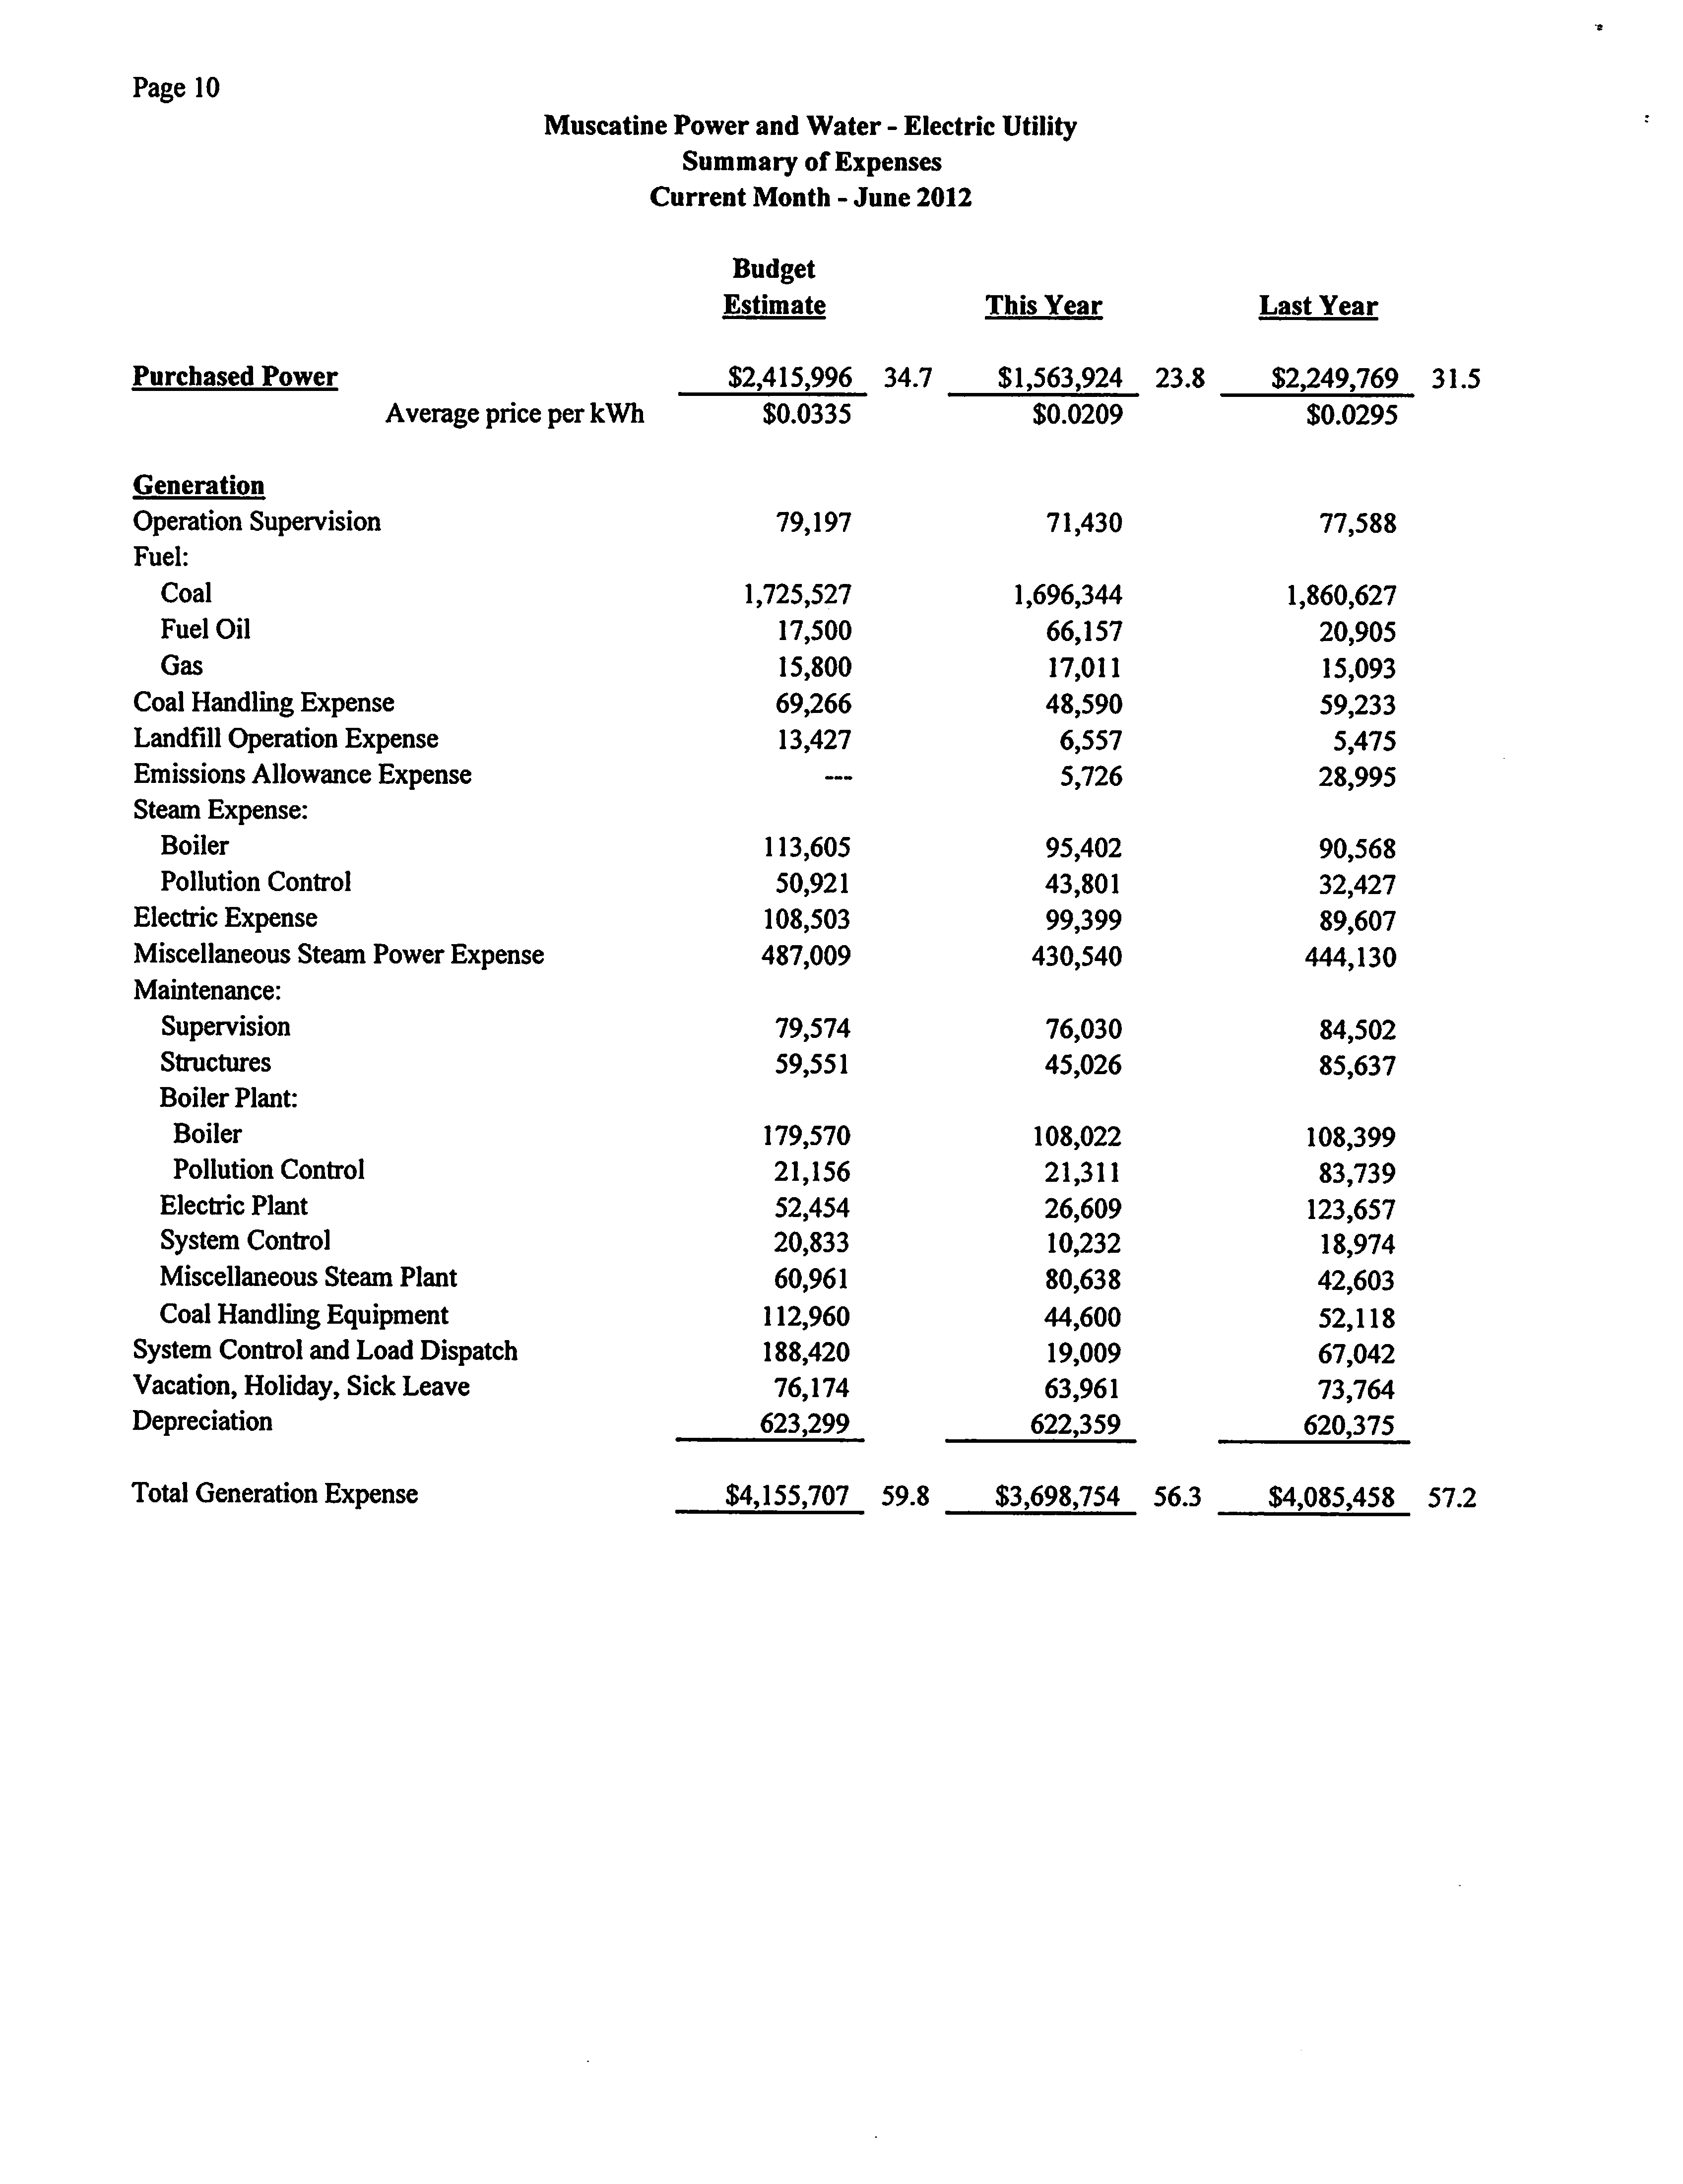
Page 10
Muscatine Power and Water - Electric Utility
Summary of Expenses
Current Month - June 2012
Purchased Power
Average price per kWh
Generation
Operation Supervision
Fuel:
Coal
Fuel Oil
Gas
Coal Handling Expense
Landfill Operation Expense
Emissions Allowance Expense
Steam Expense:
Boiler
Pollution Control
Electric Expense
Miscellaneous Steam Power Expense
Maintenance:
Supervision
Structures
Boiler Plant:
Boiler
Pollution Control
Electric Plant
System Control
Miscellaneous Steam Plant
Coal Handling Equipment
System Control and Load Dispatch
Vacation, Holiday, Sick Leave
Depreciation
Total Generation Expense
Budget
Estimate
This Year
$2,415,996 34.7
$1,563,924
$0.0335
$0.0209
79,197
71,430
Last Year
23.8
$2,249,769 31.5
$0.0295
77,588
1,725,527
1,696,344
1,860,627
17,500
66,157
20,905
15,800
17,011
15,093
69,266
48,590
59,233
13,427
6,557
5,475
—
5,726
28,995
113,605
95,402
90,568
50,921
43,801
32,427
108,503
99,399
89,607
487,009
430,540
444,130
79,574
76,030
84,502
59,551
45,026
85,637
179,570
108,022
108,399
21,156
21,311
83,739
52,454
26,609
123,657
20,833
10,232
18,974
60,961
80,638
42,603
112,960
44,600
52,118
188,420
19,009
67,042
76,174
63,961
73,764
623,299
622,359
620,375
$4,155,707 59.8
$3,698,754 56.3
$4,085,458 57.2
Muscatine Power and Water - Electric Utility
Summary of Expenses
Calendar Year-to-Date - June 2012
Page 11
Budget
Estimate
This Year
Last Year
Purchased Power
$13,717,430 31.5
$8,545,185 25.2
$12,350,704
Average price per kWh
$0.0327
$0.0200
$0.0287
Generation
Operation Supervision
494,284
447,322
484,416
Fuel:
Coal
11,489,572
7,472,831
8,543,258
Fuel Oil
106,616
111,423
223,023
Gas
113,400
74,746
115,072
Coal Handling Expense
401,840
339,212
347,750
Landfill Operation Expense
34,409
35,522
29,777
Emissions Allowance Expense
~-
28,070
226,197
Steam Expense:
Boiler
666,210
535,850
594,012
Pollution Control
280,862
159,840
166,077
Electric Expense
591,103
549,188
507,706
Miscellaneous Steam Power Expense
1,143,660
1,054,430
1,038,297
Maintenance:
Supervision
487,489
472,326
535,718
Structures
464,043
321,080
43237
Boiler Plant:
Boiler
2,061,503
1,251,756
2,610,325
Pollution Control
268,886
338,084
862,235
Electric Plant
527,140
232,090
2,237,314
System Control
123,483
93,286
128,702
Miscellaneous Steam Plant
388,588
388,222
353,530
Coal Handling Equipment
665,481
574,863
498,802
System Control and Load Dispatch
460,777
204,111
260,010
Vacation, Holiday, Sick Leave
556,878
574,040
502,403
Depreciation
3,739,796
3,734,154
3,722,250
Total Generation Expense
$25,066,020 57.6
$18,992,446 56.0
$24,419,111
Page 12
Muscatine Power and Water - Electric Utility
Summary of Expenses
Current Month - June 2012
Transmission
Operation Supervision
Load Dispatching
Station Expense
Overhead Line Expense
Transmission
of Electricity by Others
Miscellaneous Transmission Expense
Maintenance:
Supervision
Structures
Station Equipment
Overhead Lines
Vacation, Holiday, Sick Leave
Depreciation
Tax on Rural Property
Total Transmission Expense
Distribution
Operation Supervision
Load Dispatching
Station Expense
Overhead Line Expense
Vehicle Expense
Underground Line Expense
Street Lighting
Signal Expense
Meter Expense
Consumer Installation Expense
Miscellaneous Distribution Expense
Maintenance:
Supervision
Structures
Station Equipment
Overhead Lines
Underground Lines
Line Transformers
Street Lighting
Signal System
Meters
Miscellaneous Distribution Plant
Vacation, Holiday, Sick Leave
Depreciation
Tax on Rural Property
Total Distribution Expense
Budget
Estimate
$3,901
7,244
6,980
124
12,364
This Year
$4,025
55,039
6,297
2,723
5,692
Last Year
$1,178
7,702
9,133
7,029
2,041
1,942
1,379
2,972
—
—
7,145
4,643
5,282
61,231
54,030
1,540
4,672
3,790
3,411
30,643
30,625
30,592
5,606
5,606
5,822
144,923
2.1
174,412
2.7
73,068
1.0
11,448
11,244
8,567
31,581
30,165
29,377
6,973
3,283
7,154
6,679
262
9,408
16,497
13,497
20,981
3,671
3,011
4,659
1,598
3,411
2,417
733
285
75
8,346
8,245
8,431
1,211
985
1,905
58,110
46,803
63,982
10,579
10,185
8,498
2,795
—
1,691
9,546
9,744
7,295
58,928
43,003
50,705
8,320
5,752
5,238
3,271
11,834
4,130
5,612
1,657
9,461
2,102
3,149
5,723
2,527
175
(693)
3,007
1,329
1,225
21,301
23,085
18,170
152,683
152,158
148,879
1,674
1,674
1,739
$429,192
6.2
$384,936
5.9
$419,017
5.9
Muscatine Power and Water - Electric Utility
Summary of Expenses
Calendar Year-to-Date - June 2012
Budget
Estimate
Page 13
This Year
Last Year
Transmission
Operation Supervision
$23,276
$21,647
$15,464
Load Dispatching
44,276
268,957
47,109
Station Expense
46,271
46,477
42,083
Overhead Line Expense
441
2,422
870
Transmission of Electricity by Others
—
15,534
—
Miscellaneous Transmission Expense
71,319
37,104
55,064
Maintenance:
Supervision
12,046
9,306
10,186
Structures
6,494
--
—
Station Equipment
35,538
22,673
30,264
Overhead Lines
92,385
94,959
42,629
Vacation, Holiday, Sick Leave
33,847
29,687
31,757
Depreciation
183,858
183,750
183,552
Tax on Rural Property
33,634
33,722
33,701
Total Transmission Expense
583,385
1.3
766,238
2.3
492,679
Distribution
Operation Supervision
67,154
55,282
60,857
Load Dispatching
192,147
174,748
181,425
Station Expense
42,600
44,476
43,743
Overhead Line Expense
26,373
7,892
21,946
Vehicle Expense
99,010
79,184
92,519
Underground Line Expense
20,111
16,372
15,947
Street Lighting
9,289
17,668
13,238
Signal Expense
6,440
1,701
873
Meter Expense
52,610
55,283
52,843
Consumer Installation Expense
7,061
8,503
9,655
Miscellaneous Distribution Expense
346,687
314,987
322,631
Maintenance:
Supervision
61,695
49,193
57,458
Structures
6,626
—
1,691
Station Equipment
58,539
40,305
58,067
Overhead Lines
352,442
276,074
307,930
Underground Lines
50,101
35,775
27,419
LineTransformers
30,154
37,173
40,955
Street Lighting
31,570
19,819
31,302
Signal System
13,633
20,440
29,666
Meters
13,529
7,354
11,088
Miscellaneous Distribution Plant
18,043
14,059
11,244
Vacation, Holiday, Sick Leave
156,431
147,806
151,983
Depreciation
916,100
912,948
893,274
Tax on Rural Property
10,047
10,085
10,083
Total Distribution Expense
$2,588,392
5.9
$2,347,127
6.9
$2,447,837
1.3
6.5
Page 14
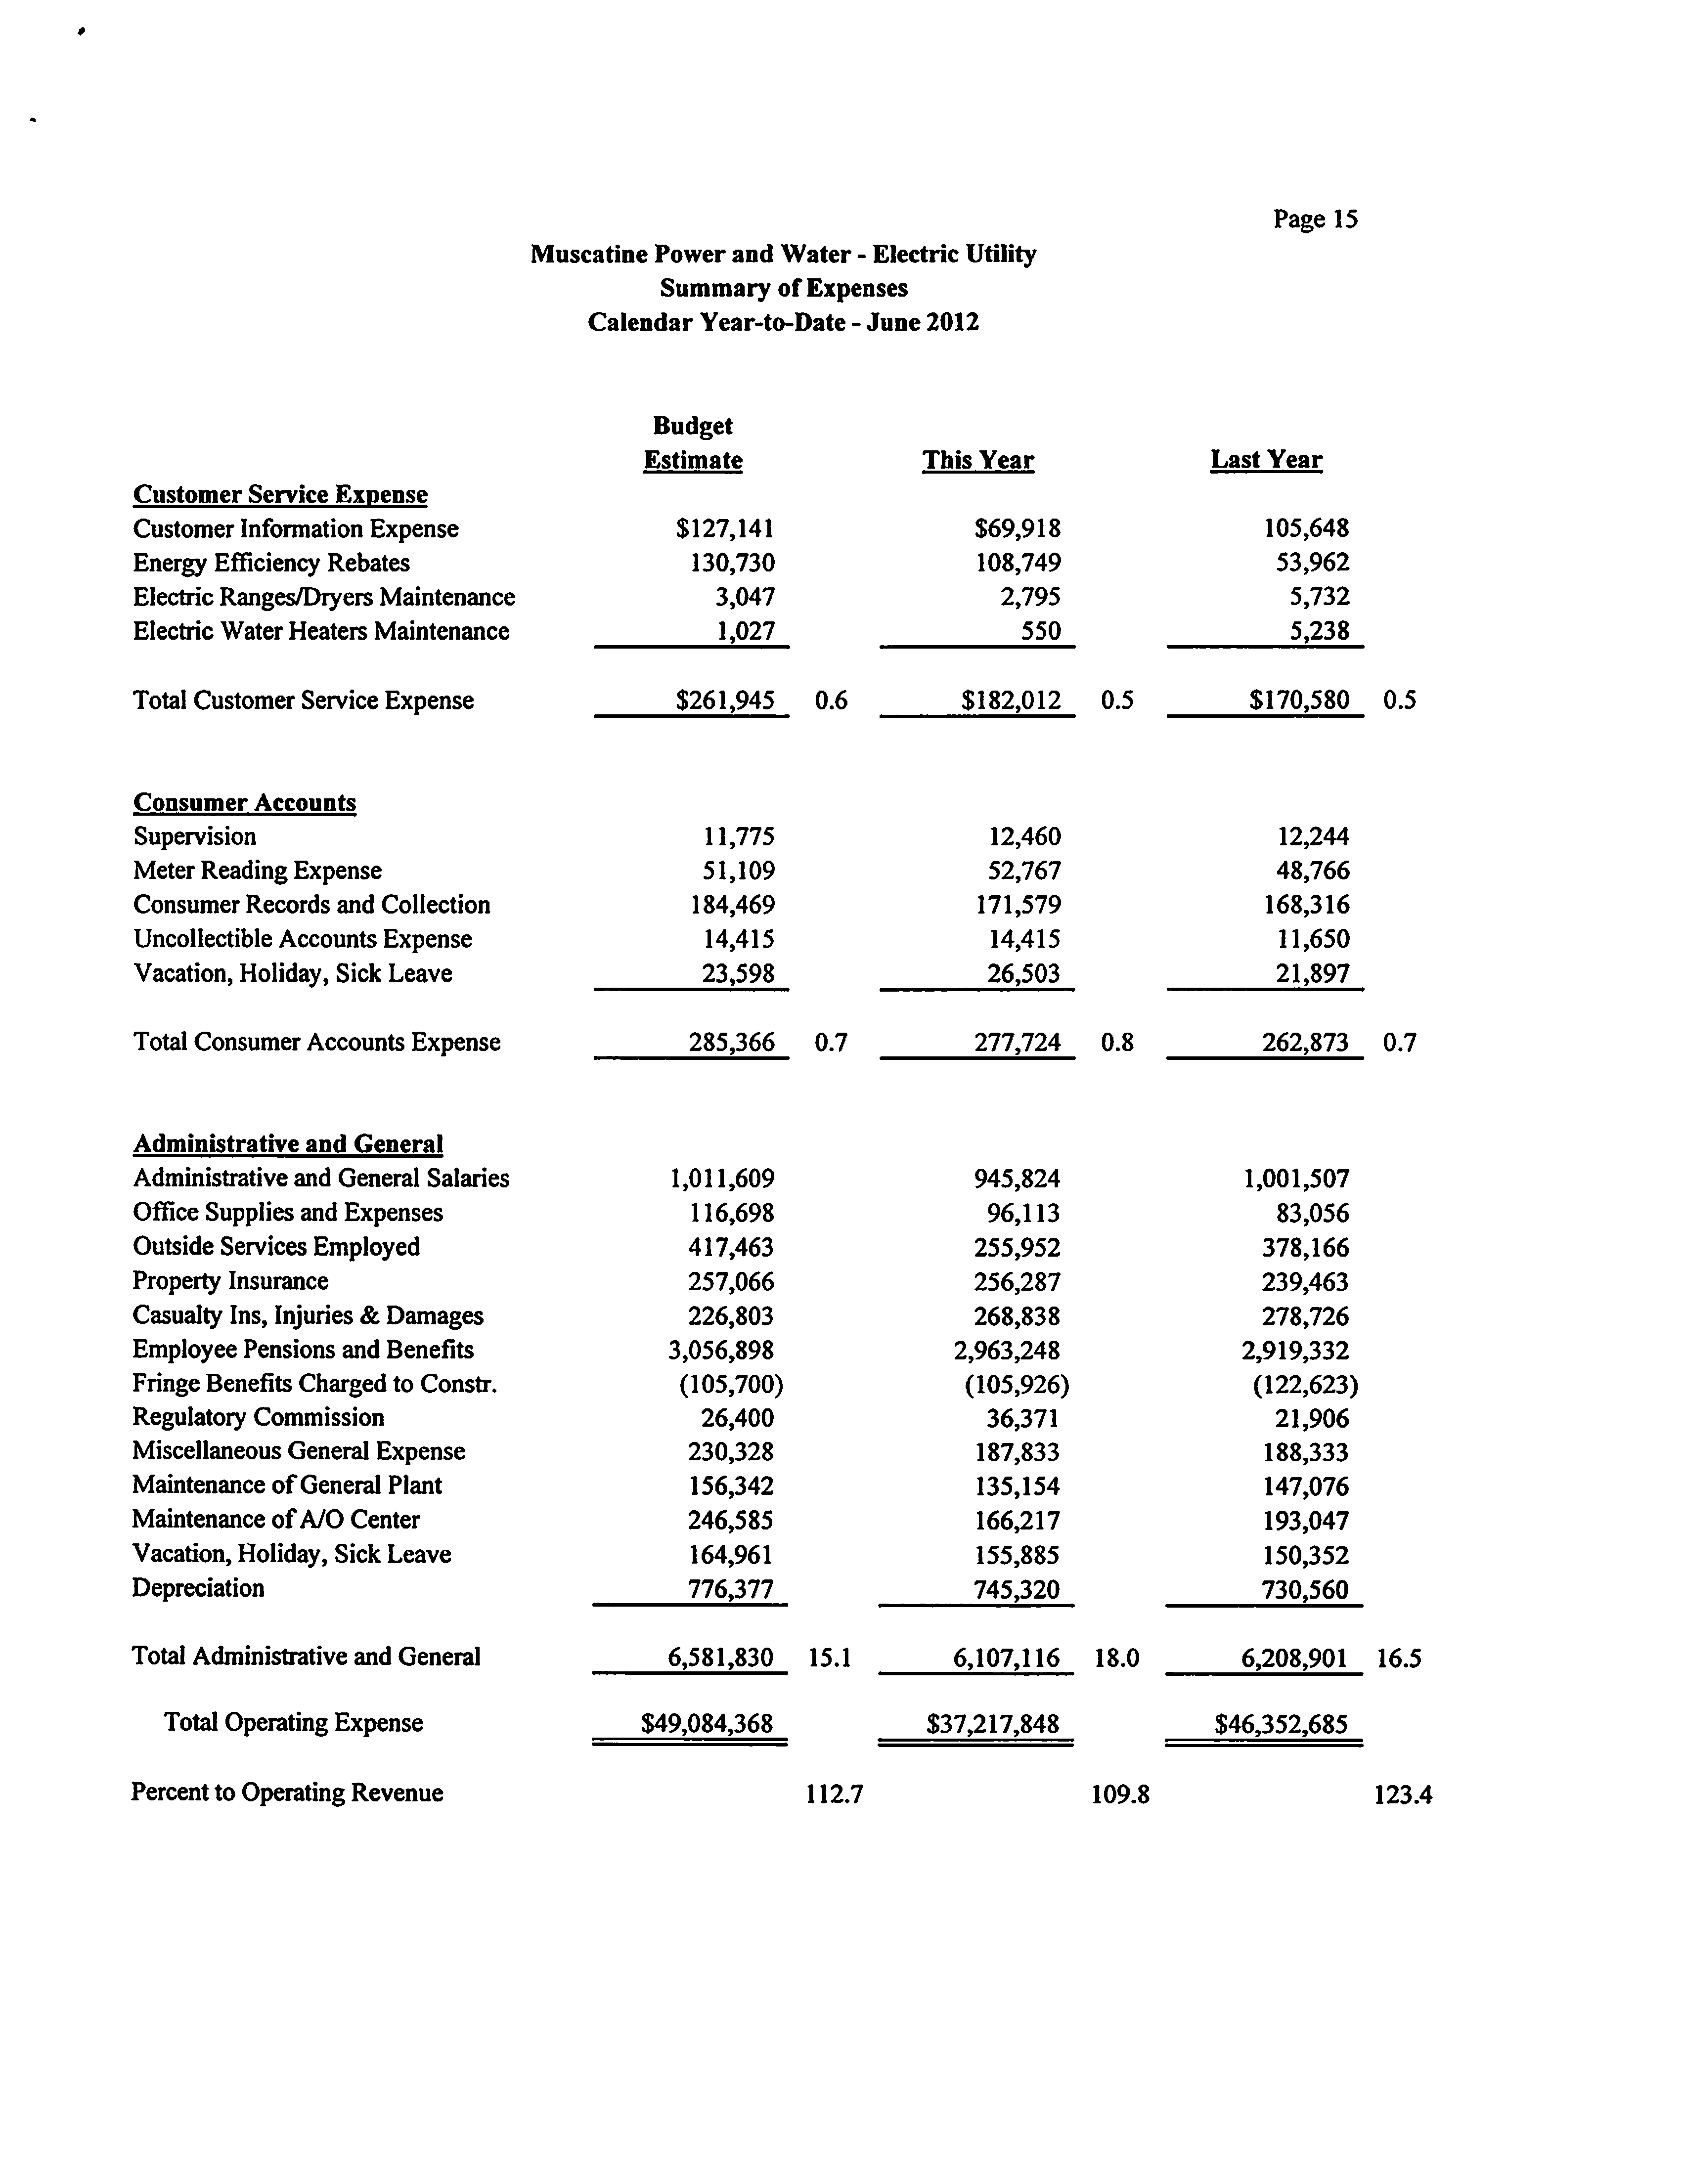
Muscatine Power and Water - Electric Utility
Summary of
Expenses
Current Month - June 2012
Customer Service Expense
Customer Information Expense
Energy Efficiency Rebates
Electric Ranges/Dryers Maintenance
Electric Water Heaters Maintenance
Total Customer Service Expense
Consumer
Accounts
Supervision
Meter Reading Expense
Consumer Records and Collection
Uncollectible Accounts Expense
Vacation, Holiday, Sick Leave
Total Consumer Accounts Expense
Administrative and General
Administrative and General Salaries
Office Supplies and Expenses
Outside Services Employed
Property Insurance
Casualty Ins, Injuries & Damages
Employee Pensions and Benefits
Fringe Benefits Charged to Constr.
Regulatory Commission
Miscellaneous General Expense
Maintenance of General Plant
Maintenance of A/O Center
Vacation, Holiday, Sick Leave
Depreciation
Total Administrative and General
Total Operating Expense
Percent to Operating Revenue
Budget
Estimate
This Year
Last Year
$32,314
$14,331
15,305
21,788
7,026
8,643
458
822
789
154
42
859
54,714
0.8
22,221
0.3
25,596
1,955
2,047
2,281
8,429
7,257
8,228
31,501
29,396
29,548
2,402
2,403
1,942
3,160
3,937
3,237
47,447 0.7
45,040
0.7
45,236
0.4
0.6
168,405
163,858
160,863
17,987
19,416
13,477
64,772
51,377
55,403
46,880
46,620
38,809
37,800
52,063
29,833
489,989
477,214
476,698
(18,725)
(14,878)
(20,120)
4,400
14,371
3,651
30,929
25,845
37,883
25,626
21,708
26,705
72,759
27,699
66,746
22,481
15,552
20,417
129,396
124,220
121,760
1,092,699 15.7
1,025,065 15.6
1,032,125 14.4
$8,340,678
$6,914,352
$7,930,269
120.0
105.3
111.0
Muscatine Power and Water - Electric Utility
Summary of Expenses
Calendar Year-to-Date - June 2012
Page 15
Budget
Estimate
This Year
Last Year
Customer Service Expense
Customer Information Expense
$127,141
$69,918
105,648
Energy Efficiency Rebates
130,730
108,749
53,962
Electric Ranges/Dryers Maintenance
3,047
2,795
5,732
Electric Water Heaters Maintenance
1,027
550
5,238
Total Customer Service Expense
$261,945
0.6
$182,012
0.5
$170,580
Consumer Accounts
Supervision
11,775
12,460
12,244
Meter Reading Expense
51,109
52,767
48,766
Consumer Records and Collection
184,469
171,579
168,316
Uncollectible Accounts Expense
14,415
14,415
11,650
Vacation, Holiday, Sick Leave
23,598
26,503
21,897
Total Consumer Accounts Expense
285,366
0.7
277,724
0.8
262,873
Administrative and General
0.5
0.7
Administrative and General Salaries
Office Supplies and Expenses
Outside Services Employed
Property Insurance
Casualty Ins, Injuries & Damages
Employee Pensions and Benefits
Fringe Benefits Charged to Constr.
Regulatory Commission
Miscellaneous General Expense
Maintenance of General
Plant
Maintenance of A/O Center
Vacation, Holiday, Sick Leave
Depreciation
Total Administrative and General
Total Operating Expense
Percent to Operating Revenue
1,011,609
945,824
1,001,507
116,698
96,113
83,056
417,463
255,952
378,166
257,066
256,287
239,463
226,803
268,838
278,726
3,056,898
2,963,248
2,919,332
(105,700)
(105,926)
(122,623)
26,400
36,371
21,906
230,328
187,833
188,333
156,342
135,154
147,076
246,585
166,217
193,047
164,961
155,885
150,352
776,377
745,320
730,560
6,581,830
15.1
6,107,116
18.0
6,208,901 16.5
$49,084,368
$37,217,848
$46,352,685
112.7
109.8
123.4
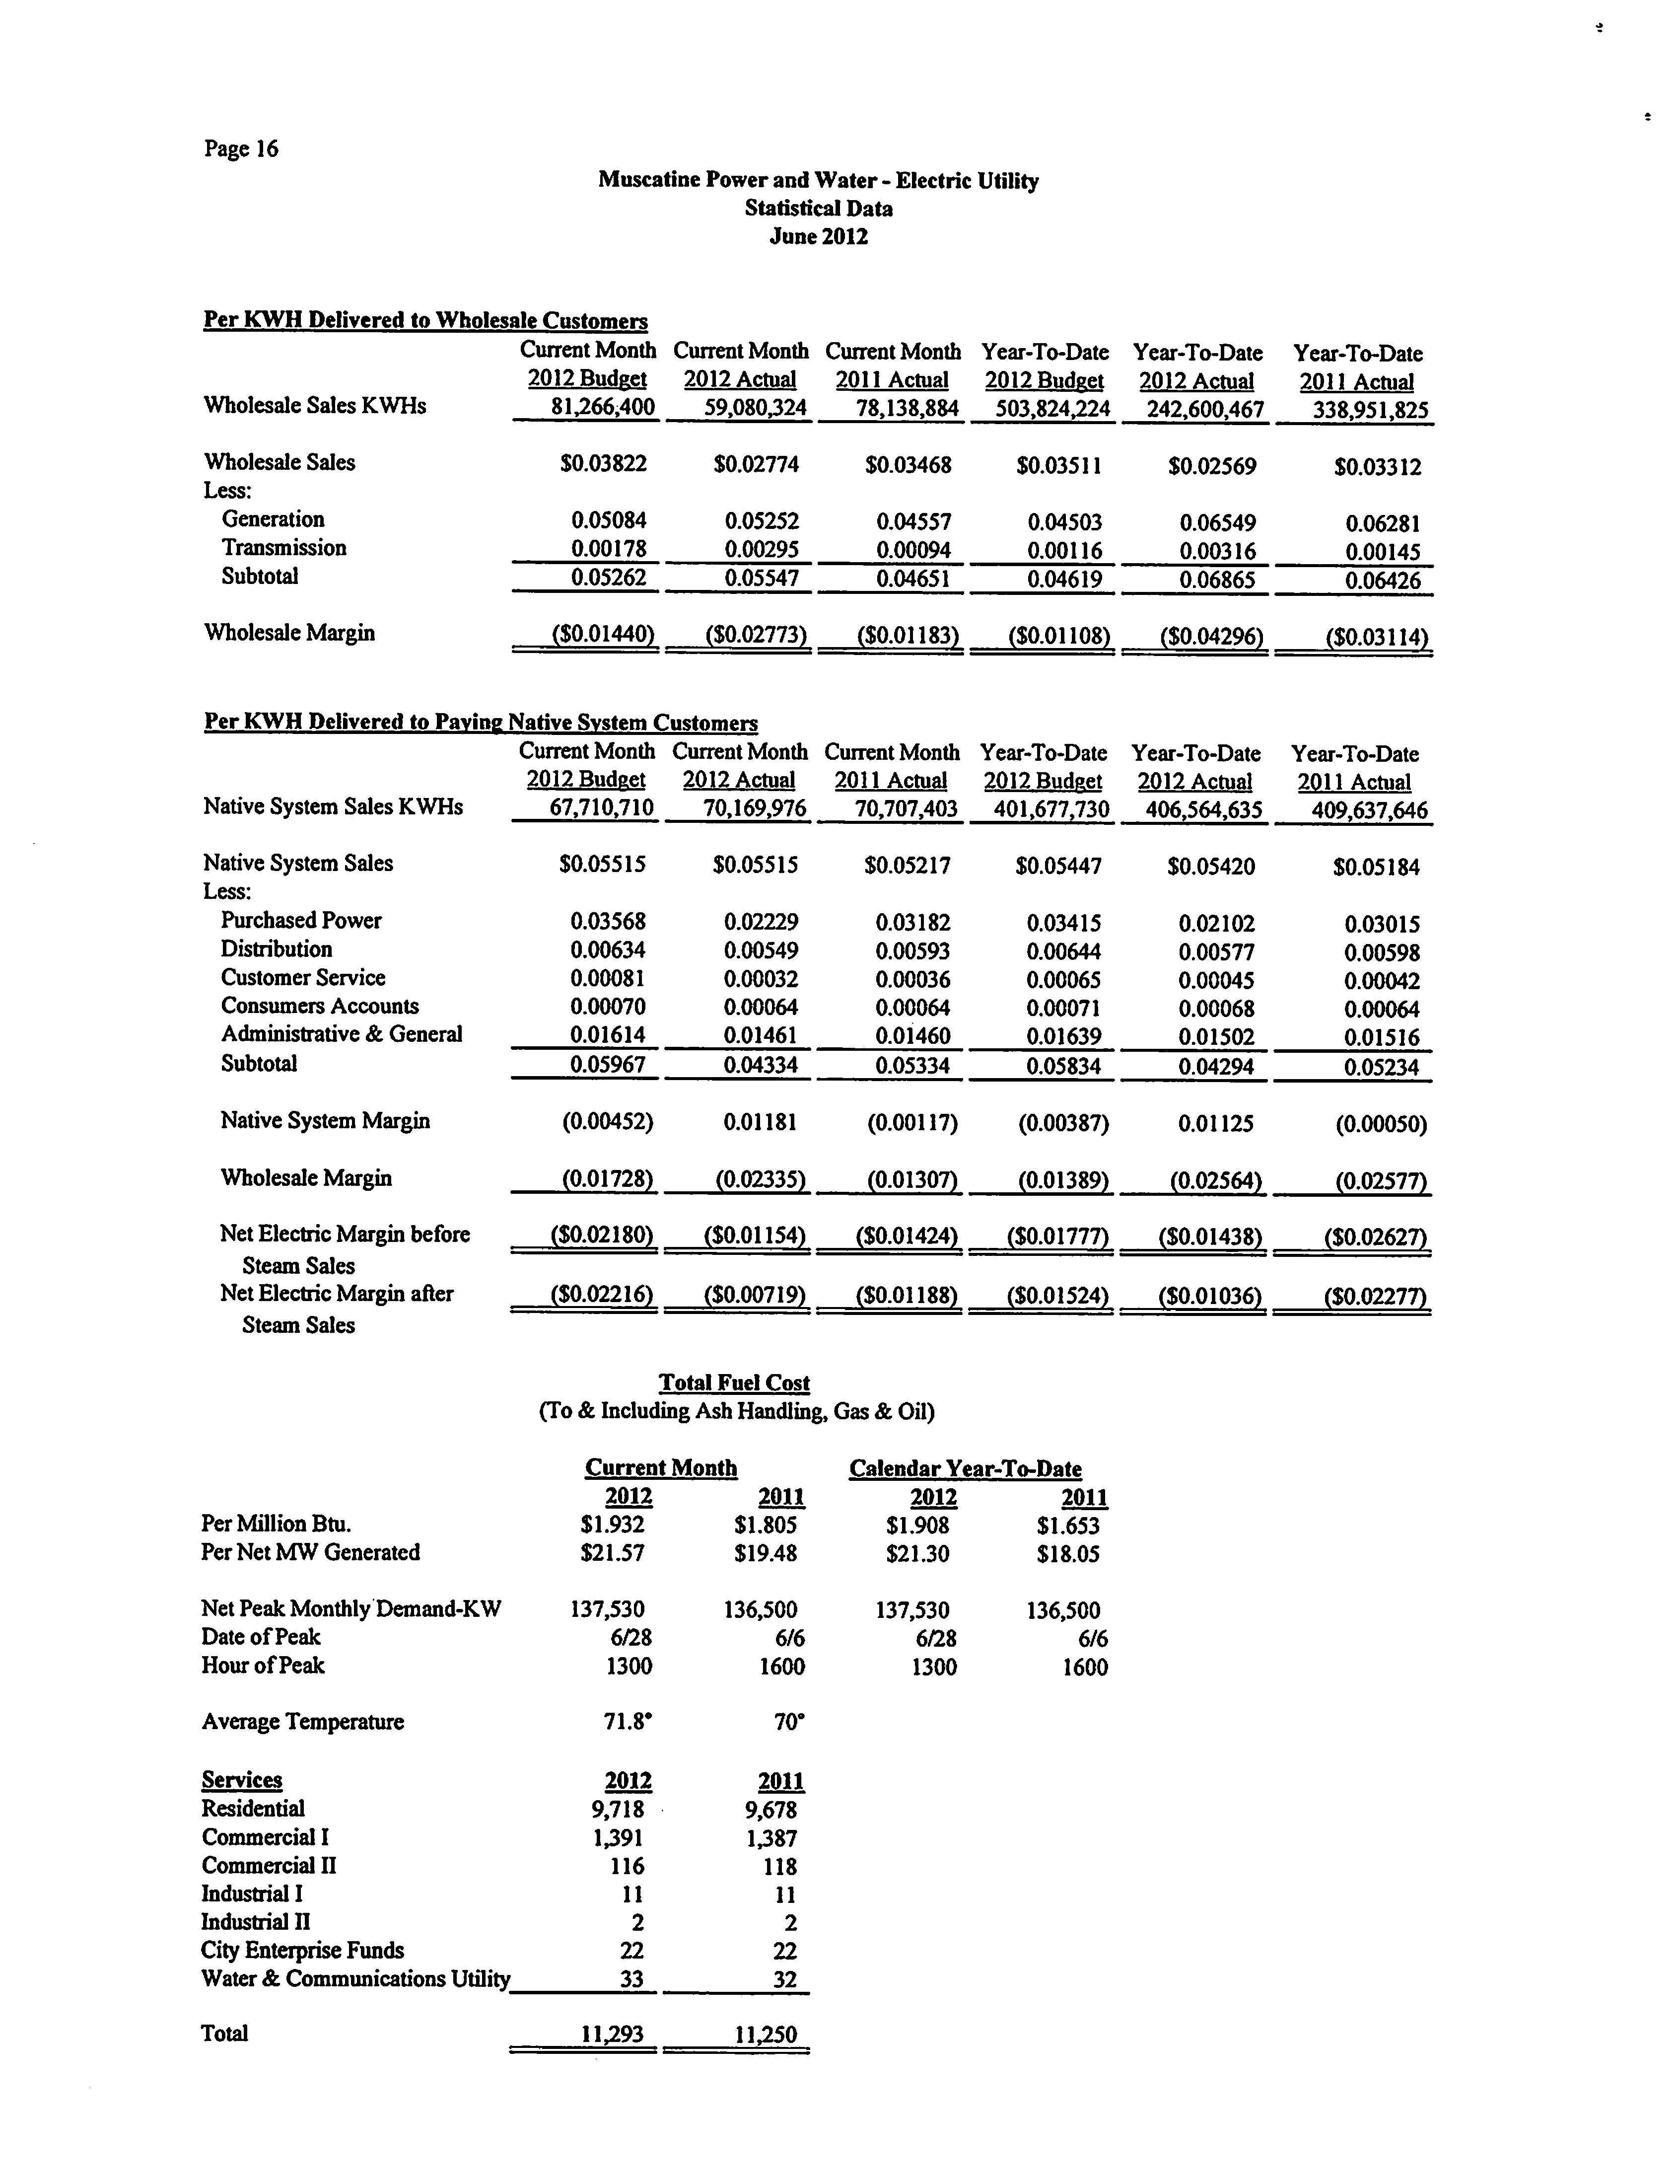
Page 16
Muscatine Power and Water - Electric Utility
Statistical Data
June 2012
Per KWH Delivered to Wholesale Customers
Wholesale Sales KWHs
Current Month
2012 Budget
81,266,400
Current Month
2012 Actual
59,080324
Current Month
2011 Actual
78,138,884
Year-To-Date
2012 Budeet
503,824,224
Year-To-Date
2012 Actual
242,600,467
Year-To-Date
2011 Actual
338,951,825
Wholesale Sales
Less:
Generation
Transmission
$0.03822
0.05084
0.00178
$0.02774
0.05252
0.00295
$0.03468
0.04557
0.00094
$0.03511
0.04503
0.00116
$0.02569
0.06549
0.00316
$0.03312
0.06281
0.00145
Subtotal
0.05262
0.05547
0.04651
0.04619
0.06865
0.06426
Wholesale Margin
($0.01440)
($0.02773)
($0.01183)
($0.01108)
($0.04296)
($0.03114)
Per KWH Delivered to Paving
Native System Sales KWHs
Native Svstem Customers
Current Month Current Month
2012 Budeet
2012 Actual
67,710,710
70,169,976
Current Month
2011 Actual
70,707,403
Year-To-Date
2012 Budeet
401,677,730
Year-To-Date
2012 Actual
406,564,635
Year-To-Date
2011 Actual
409,637,646
Native System Sales
Less:
Purchased Power
Distribution
Customer Service
Consumers Accounts
Administrative & General
$0.05515
0.03568
0.00634
0.00081
0.00070
0.01614
$0.05515
0.02229
0.00549
0.00032
0.00064
0.01461
$0.05217
0.03182
0.00593
0.00036
0.00064
0.01460
$0.05447
0.03415
0.00644
0.00065
0.00071
0.01639
$0.05420
0.02102
0.00577
0.00045
0.00068
0.01502
$0.05184
0.03015
0.00598
0.00042
0.00064
0.01516
Subtotal
0.05967
0.04334
0.05334
0.05834
0.04294
0.05234
Native System Margin
Wholesale Margin
(0.00452)
(0.01728)
0.01181
(0.02335)
(0.00117)
(0.01307)
(0.00387)
(0.01389)
0.01125
(0.02564)
(0.00050)
(0.02577)
Net Electric Margin before
($0.02180)
($0.01154)
($0.01424)
($0.01777)
($0.01438)
($0.02627)
Steam Sales
Net Electric Margin after
($0.02216)
($0.00719)
($0.01188)
($0.01524)
($0.01036)
($0.02277)
Steam Sales
Total Fuel Cost
(To & Including Ash Handling,Gas & Oil)
Current Month
Calendar Year-To-Date
2012
2011
2012
2011
Per Million Btu.
$1,932
$1,805
$1,908
$1,653
Per Net MW Generated
$21.57
$19.48
$21.30
$18.05
Net Peak Monthly Demand-KW
137,530
136,500
137,530
136,500
Date of Peak
6/28
6/6
6/28
6/6
Hour of Peak
1300
1600
1300
1600
Average Temperature
71.8*
70"
Services
2012
9,718
2011
Residential
9,678
Commercial I
1,391
1,387
Commercial II
116
118
Industrial I
11
11
Industrial n
2
2
City Enterprise Funds
22
22
Water & Communications Utility
33
32
Total
11,293
11,250
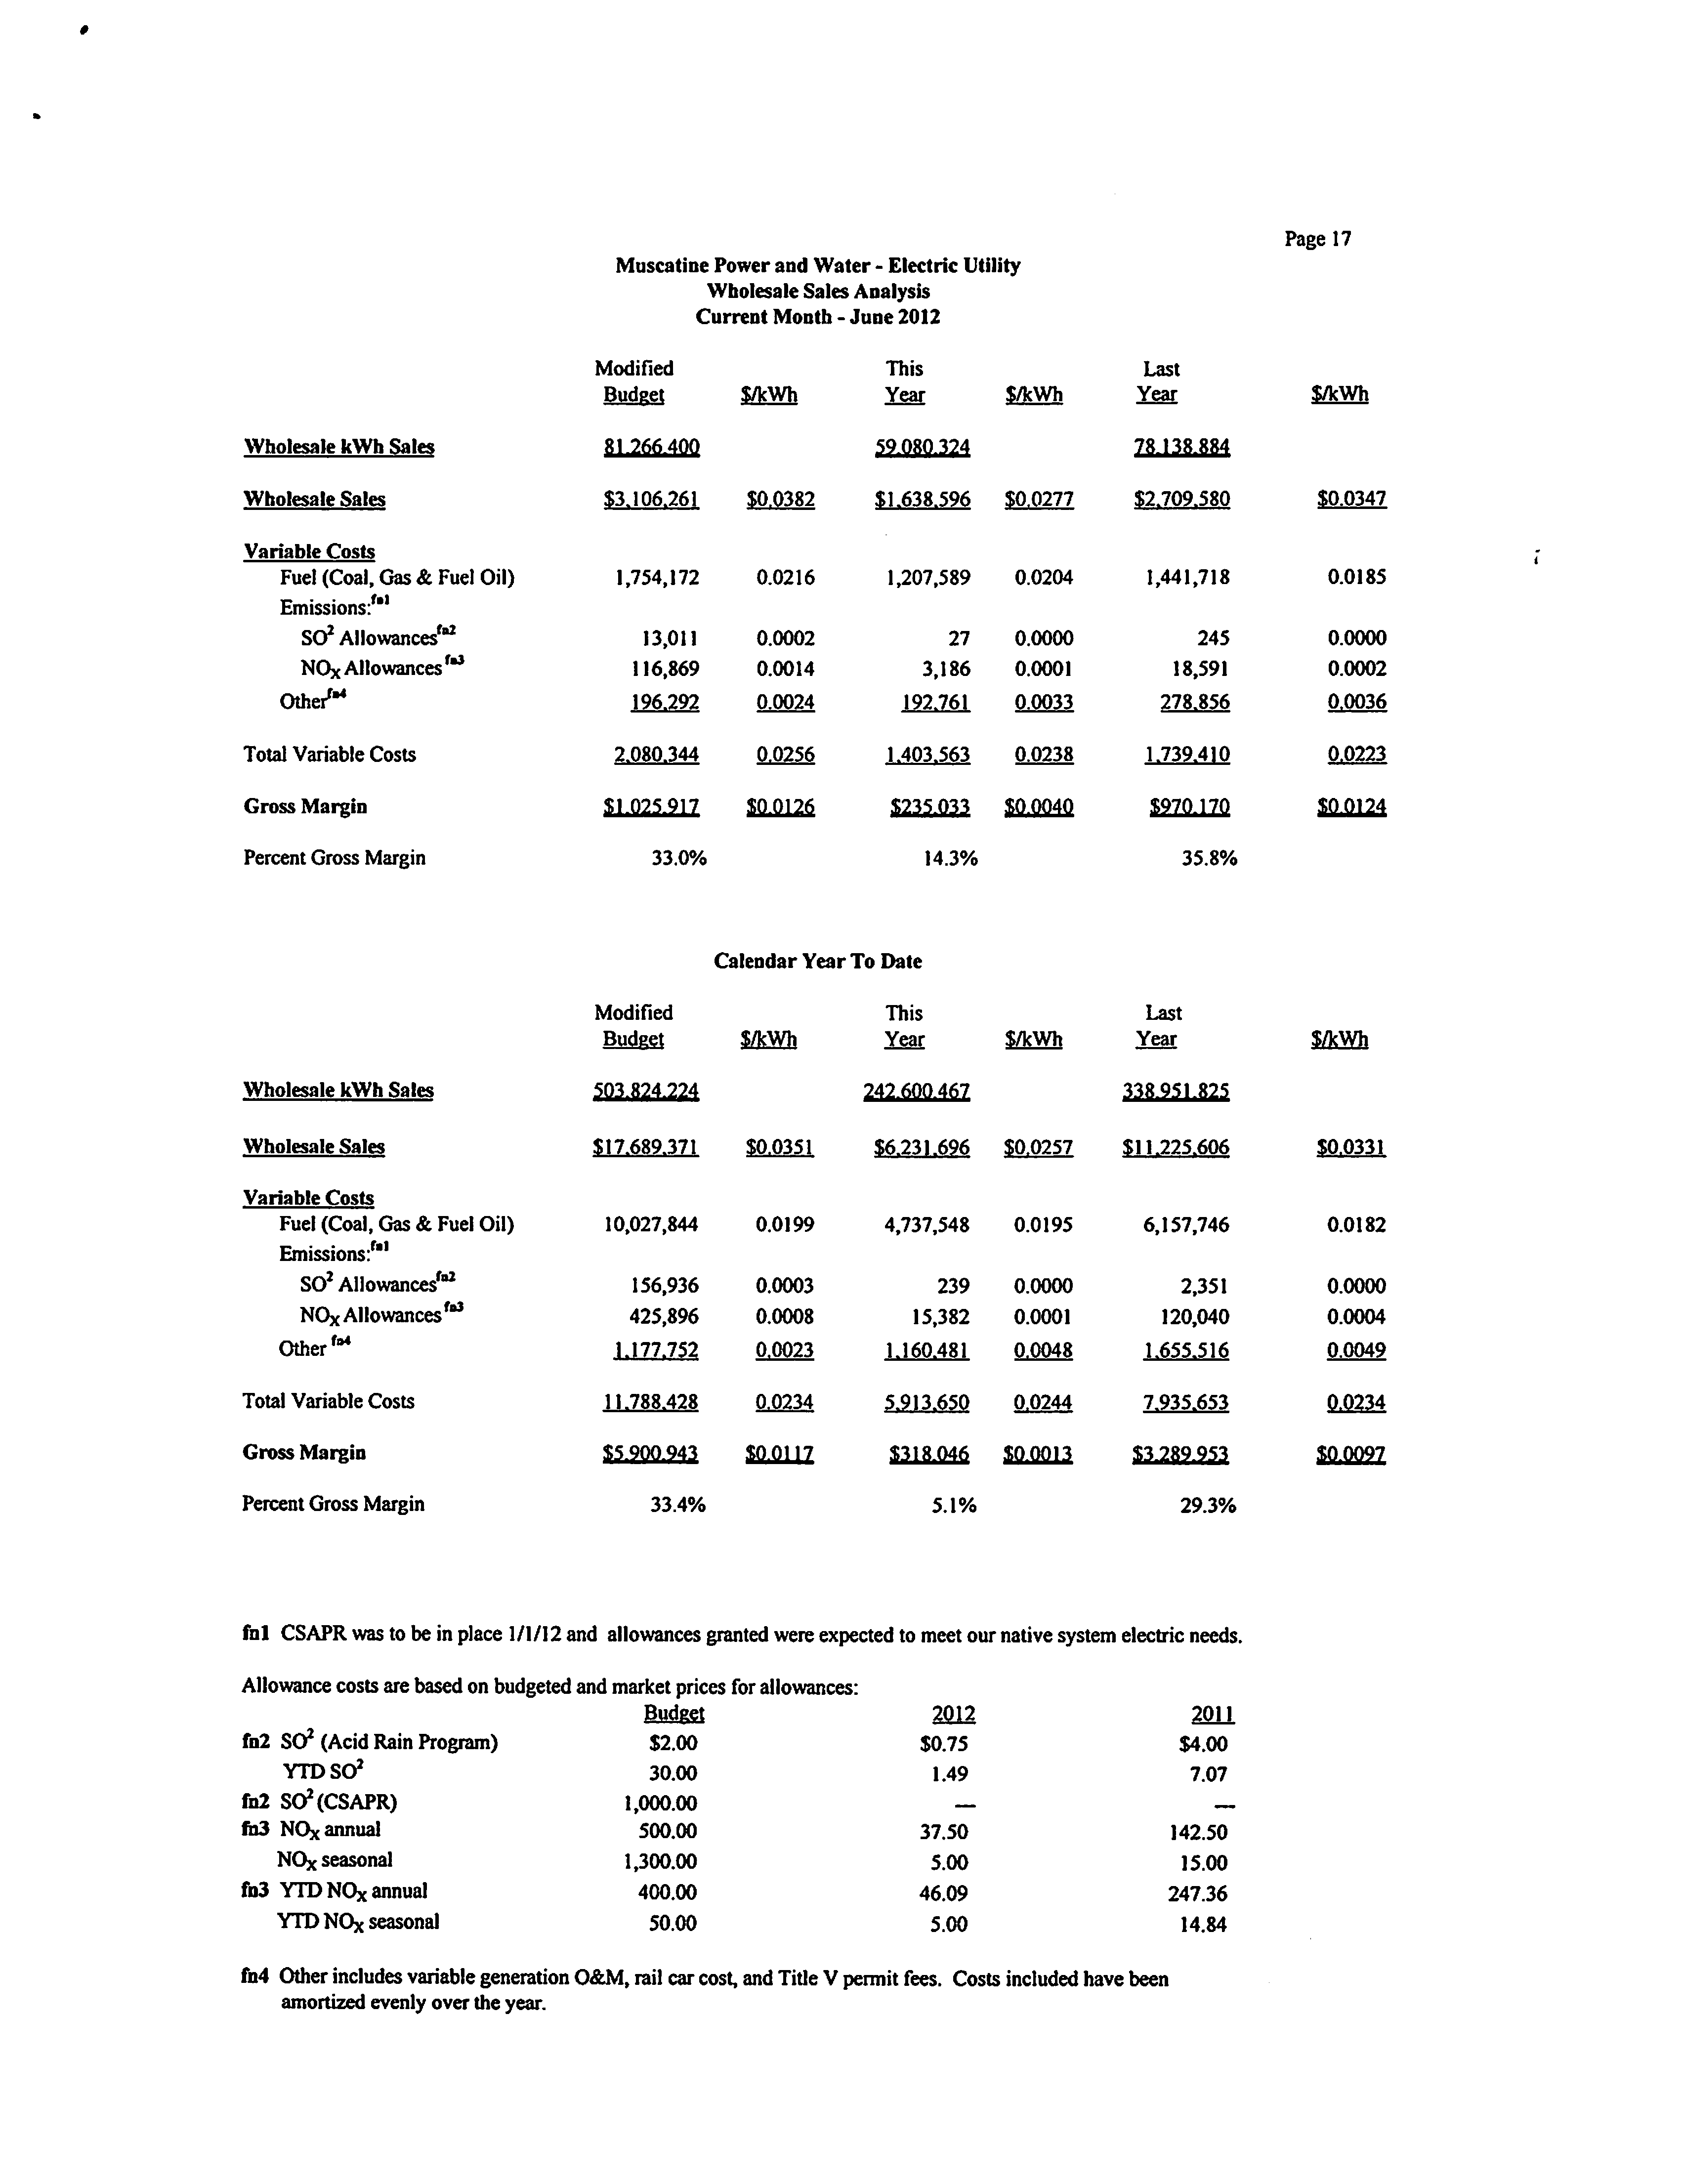
Muscatine Power and Water - Electric Utility
Wholesale Sales Analysis
Current Month - June 2012
Page 17
Modified
This
Last
Budeet
$/kWh
Year
$/kWh
Year
$/kWh
Wholesale kWh Sales
81266 400
59,080,324
78 138.884
Wholesale Sales
$3,106,261
$0.0382
$1,638,596
$0.0277
$2,709,580
$0.0347
Variable Costs
Fuel (Coal, Gas & Fuel Oil)
1,754,172
0.0216
1,207,589
0.0204
1,441,718
0.0185
Emissions:'*1
SO2Allowances''1
13,011
0.0002
27
0.0000
245
0.0000
NOx Allowances '"*
116,869
0.0014
3,186
0.0001
18,591
0.0002
Other"4
196.292
0.0024
192.761
0.0033
278.856
0.0036
Total Variable Costs
2.080.344
0,0256
1.403.563
0.0238
1.739.410
0.0223
Gross Margin
$1,025,917
$0 0126
$235,033
$0 0040
$970,170
$0 0124
Percent Gross Margin
33.0%
14.3%
35.8%
Calendar Year To Date
Modified
This
Last
Budeet
$/kWh
Year
$/kWh
Year
mm
Wholesale kWh Sales
503,824.224
242.600 467
338 951825
Wholesale Sales
$17,689,371
$0.0351
$6,231,696
$0.0257
$11,225,606
$0.0331
Variable Costs
Fuel (Coal, Gas & Fuel Oil)
10,027,844
0.0199
4,737,548
0.0195
6,157,746
0.0182
Emissions:'*1
SO2Allowances'02
156,936
0.0003
239
0.0000
2,351
0.0000
NOx Allowances'*3
425,896
0.0008
15,382
0.0001
120,040
0.0004
OtherM
1.177.752
0,0023
1.160.481
0,0048
1.655.516
0.0049
Total Variable Costs
11.788.428
0,0234
5.913.650
0,0244
7.935.653
Q,Q?34
Gross Margin
$5.9W.943
$0 0117
$318,046
$0 0013
$3,289,953
$0 0097
PercentGross Margin
33.4%
5.1%
29.3%
fnl CSAPR was to be in place 1/1/12and allowances granted wereexpectedto meet our native system electric needs.
Allowancecosts are based on budgeted and market prices for allowances:
Bydggt
2012
fn2 SO2 (Acid Rain Program)
$2.00
$0.75
YTDSO2
30.00
1.49
fn2 SO2 (CSAPR)
1,000.00
—
fn3 NOx annual
500.00
37.50
NOx seasonal
1,300.00
5.00
fn3 YTD NOx annual
400.00
46.09
YTD NOx seasonal
50.00
5.00
2011
$4.00
7.07
142.50
15.00
247.36
14.84
fn4 Otherincludes variable generation O&M, rail carcost,andTitle V pennit fees. Costs included have been
amortized evenly over the year.