Muscatine Power and Water
Communications Utility
Operating Statements and Balance Sheets
June 2012
Muscatine Power and Water
Communications Utility
Table of Contents
Page
Statements of Revenues, Expenses, and Changes in Net Deficit
1-2
Balance Sheets
3-4
Statements of Cash Flows
5-6
Summary of Expenses
7-10
Statistical Data
11
Muscatine Power and Water - Communications Utility
Statements of Revenues, Expenses, and Changes in Net Deficit
Current Month - June 2012
Pagel
Operating Revenue
CATV
Data/Internet
MAN/MME
Miscellaneous
Total Operating Revenues
Operating Expense
Operation
Maintenance
Depreciation
Amortization
Total Operating Expenses
Operating Income
Nonoperating
Revenue (Expensed
Interest Income
Interest Expense
Net Nonoperating Expense
Net
Loss
before Capital Contributions
Capital Contributions
Change in Net Deficit
Beginning Net Deficit
Ending Net Deficit
NetLoss to Total Income
Debt Service Coverage on Bank Debt
Debt Service Coverage on Bank and
Electric Utility Debt
%
Increase
%
Increase
Budget
(Decrease)
This
(Decrease)
Last
Estimate
From Budget
Year
Fr. Last Yr.
Year
$672,125
(4.0)
$645,301
1.6
$634,843
301,575
1.7
306,842
5.5
290,843
53,768
(21.0)
42,496
44.7
29,362
8,768
(2.7)
8,531
(4.7)
8,948
1,036,236
(3.2)
1,003,170
4.1
963,996
667,242
(0.9)
661,032
11.2
594,549
71,958
(7.0)
66,955
(6.8)
71,838
206,959
(5.5)
195,673
(1.3)
198,323
64,428
0.0
64,428
—
64,428
1,010,587
(2.2)
988,088
6.3
929,138
25,649
(41.2)
15,082
(56.7)
34,858
12,119
(22.2)
9,424
(18.5)
11,566
(120,047)
(0.1)
(119,924)
(2.2)
(122,578)
(107,928)
2.4
(110,500)
(0.5)
(111,012)
(82,279)
16.0
(95,418)
25.3
(76,154)
—
""•*
353
($95,065)
___
___
($82,279)
($76,154)
(22,764,121)
(22,808,798)
(21,596,872)
($22,846,400)
($22,903,863)
($21,673,026)
(7.9)
(9.4)
(7.8)
3.38
3.11
3.34
1.58
1.46
1.57
Page 2
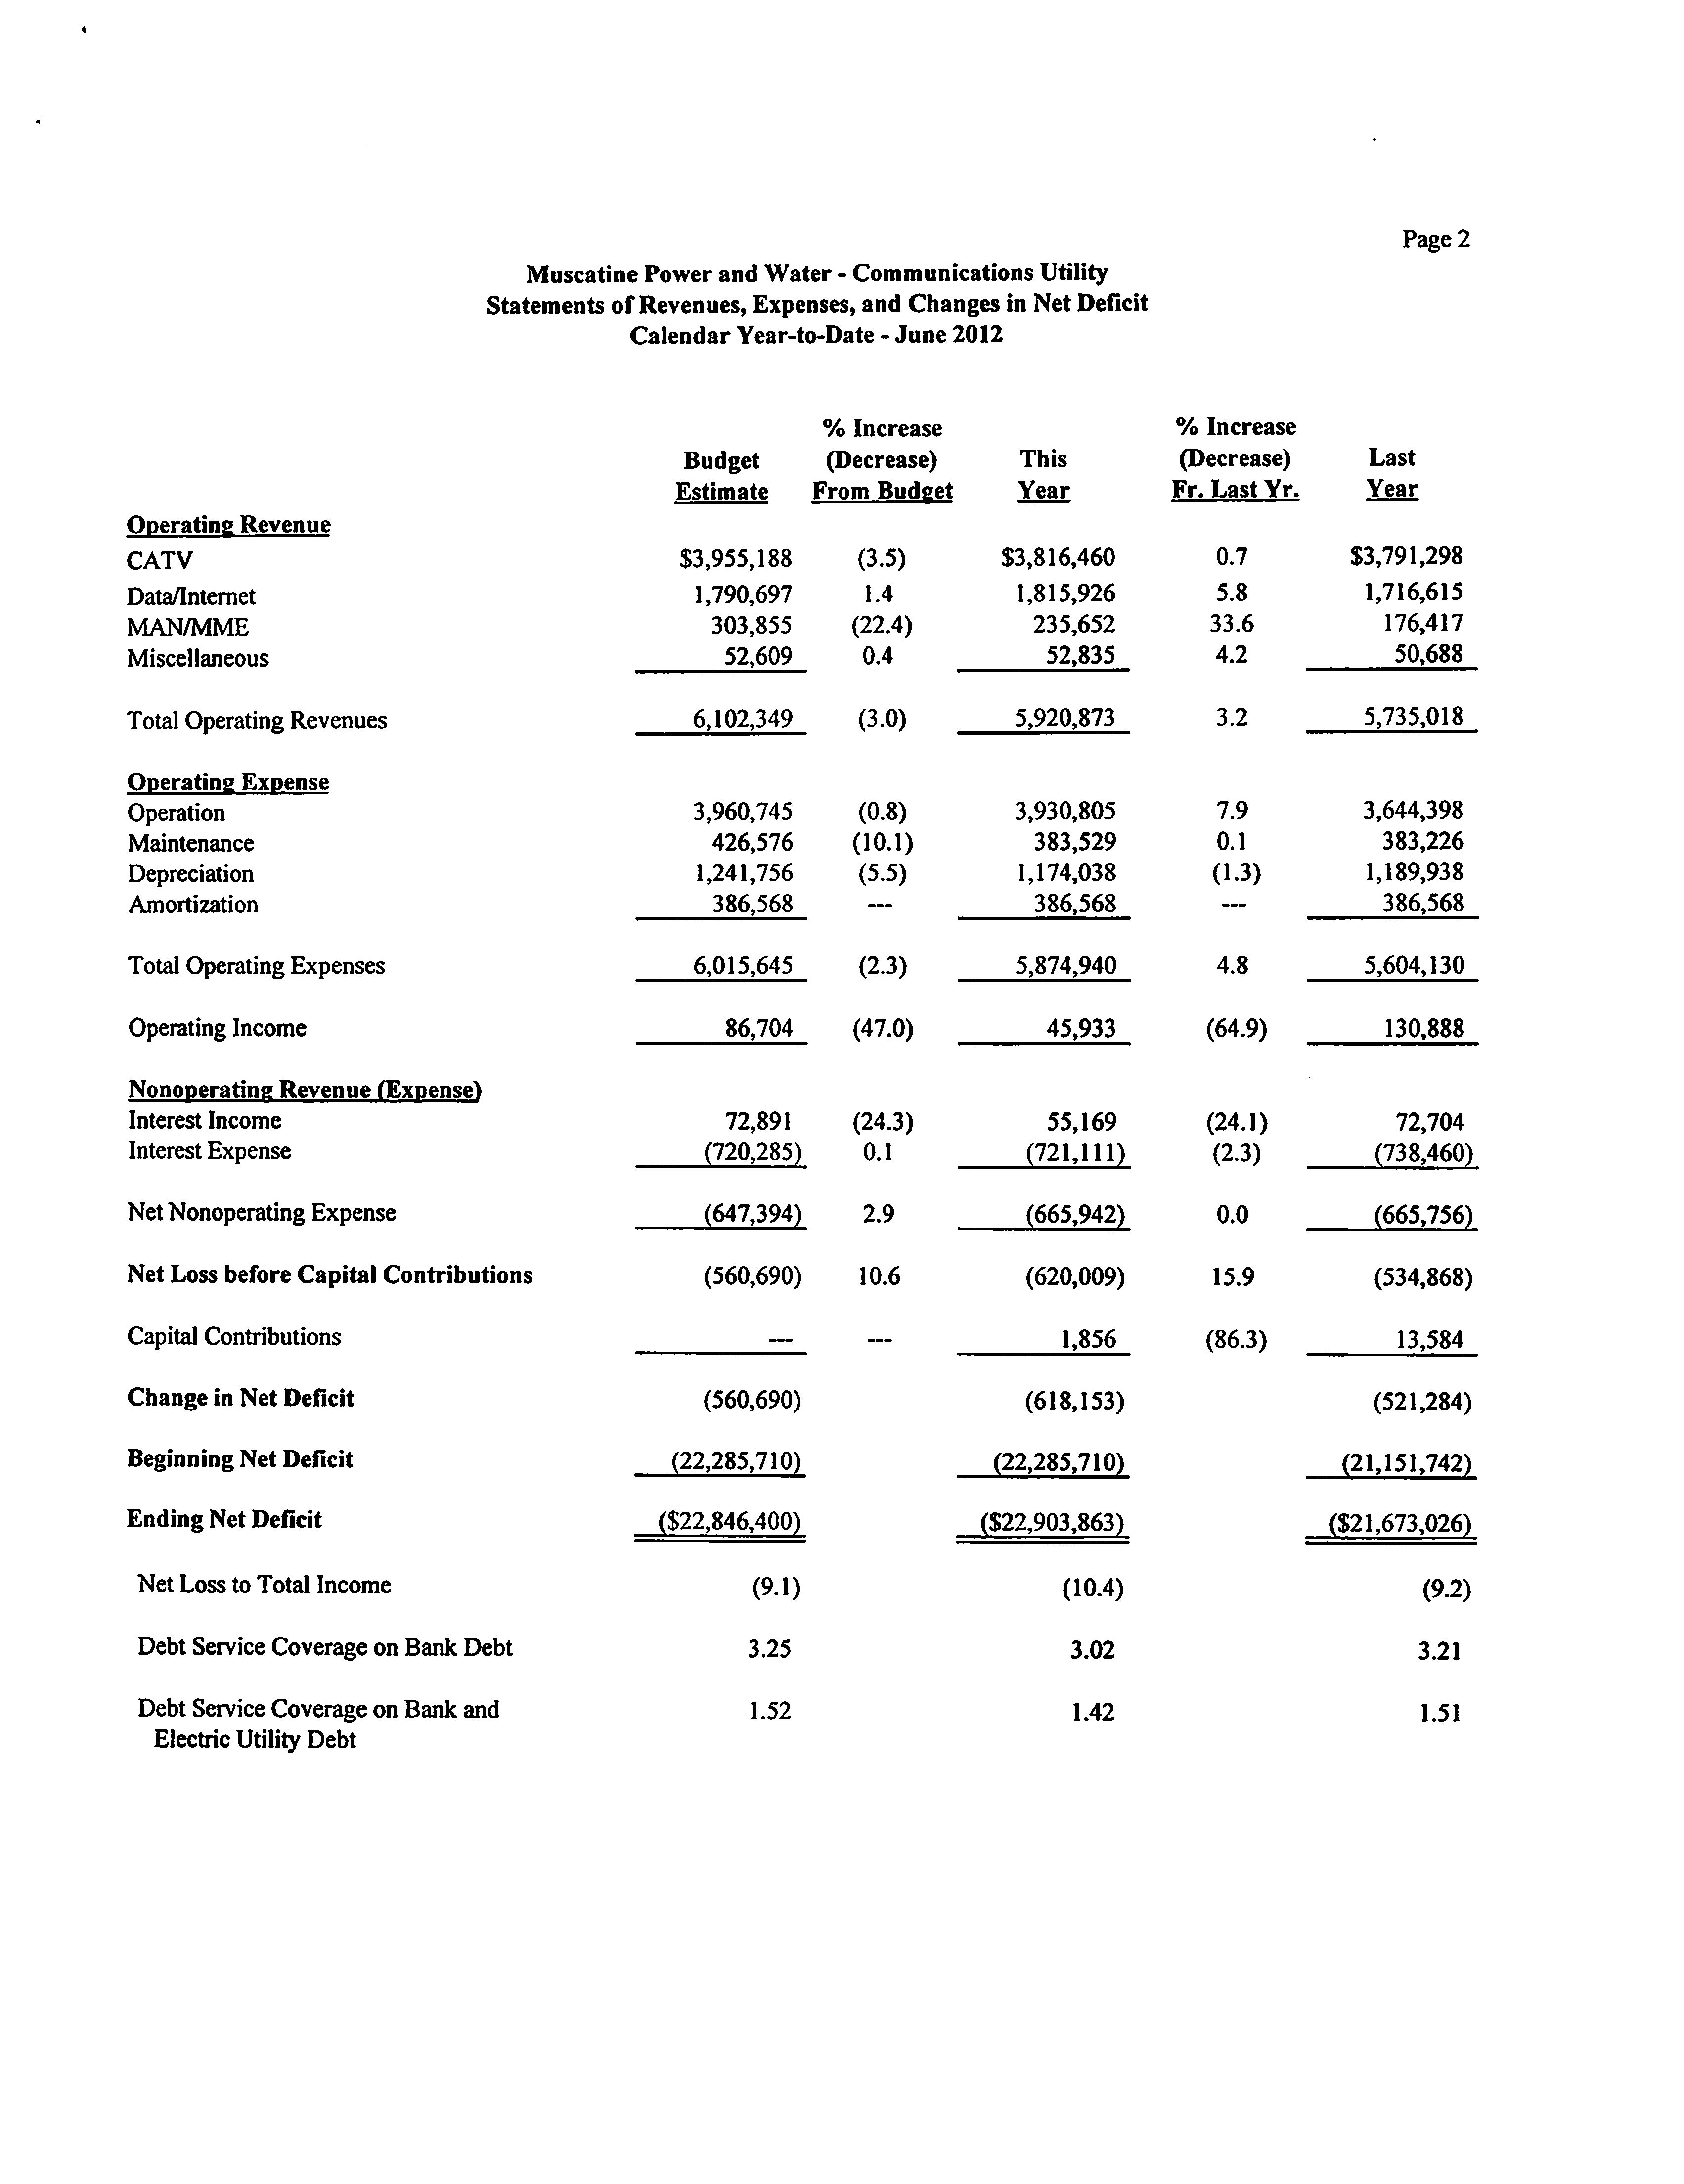
Muscatine Power and Water - Communications Utility
Statements of Revenues, Expenses, and Changes in Net Deficit
Calendar Year-to-Date - June 2012
Operating Revenue
CATV
Data/Internet
MAN/MME
Miscellaneous
Total Operating Revenues
Operating Expense
Operation
Maintenance
Depreciation
Amortization
Total Operating Expenses
Operating Income
Nonoperating Revenue
(Expense)
Interest Income
Interest Expense
Net Nonoperating Expense
Net Loss before Capital
Contributions
Capital Contributions
Change in Net Deficit
Beginning
Net Deficit
Ending Net Deficit
Net Loss to Total Income
Debt Service Coverage on Bank Debt
Debt Service Coverage on Bank and
Electric Utility Debt
%
Increase
%
Increase
Budget
(Decrease)
This
(Decrease)
Last
Estimate
From Budget
Year
Fr. Last Yr.
Year
$3,955,188
(3.5)
$3,816,460
0.7
$3,791,298
1,790,697
1.4
1,815,926
5.8
1,716,615
303,855
(22.4)
235,652
33.6
176,417
52,609
0.4
52,835
4.2
50,688
6,102,349
(3.0)
5,920,873
3.2
5,735,018
3,960,745
(0.8)
3,930,805
7.9
3,644,398
426,576
(10.1)
383,529
0.1
383,226
1,241,756
(5.5)
1,174,038
(1.3)
1,189,938
386,568
—
386,568
—
386,568
6,015,645
(2.3)
5,874,940
4.8
5,604,130
86,704
(47.0)
45,933
(64.9)
130,888
72,891
(24.3)
55,169
(24.1)
72,704
(720,285)
0.1
(721,111)
(2.3)
(738,460)
(647,394)
2.9
(665,942)
0.0
(665,756)
(560,690)
10.6
(620,009)
15.9
(534,868)
...
1,856
(618,153)
(86.3)
13,584
(560,690)
(521,284)
(22,285,710)
(22,285,710)
(21,151,742)
($22,846,400)
($22,903,863)
($21,673,026)
(9.1)
(10.4)
(9.2)
3.25
3.02
3.21
1.52
1.42
1.51
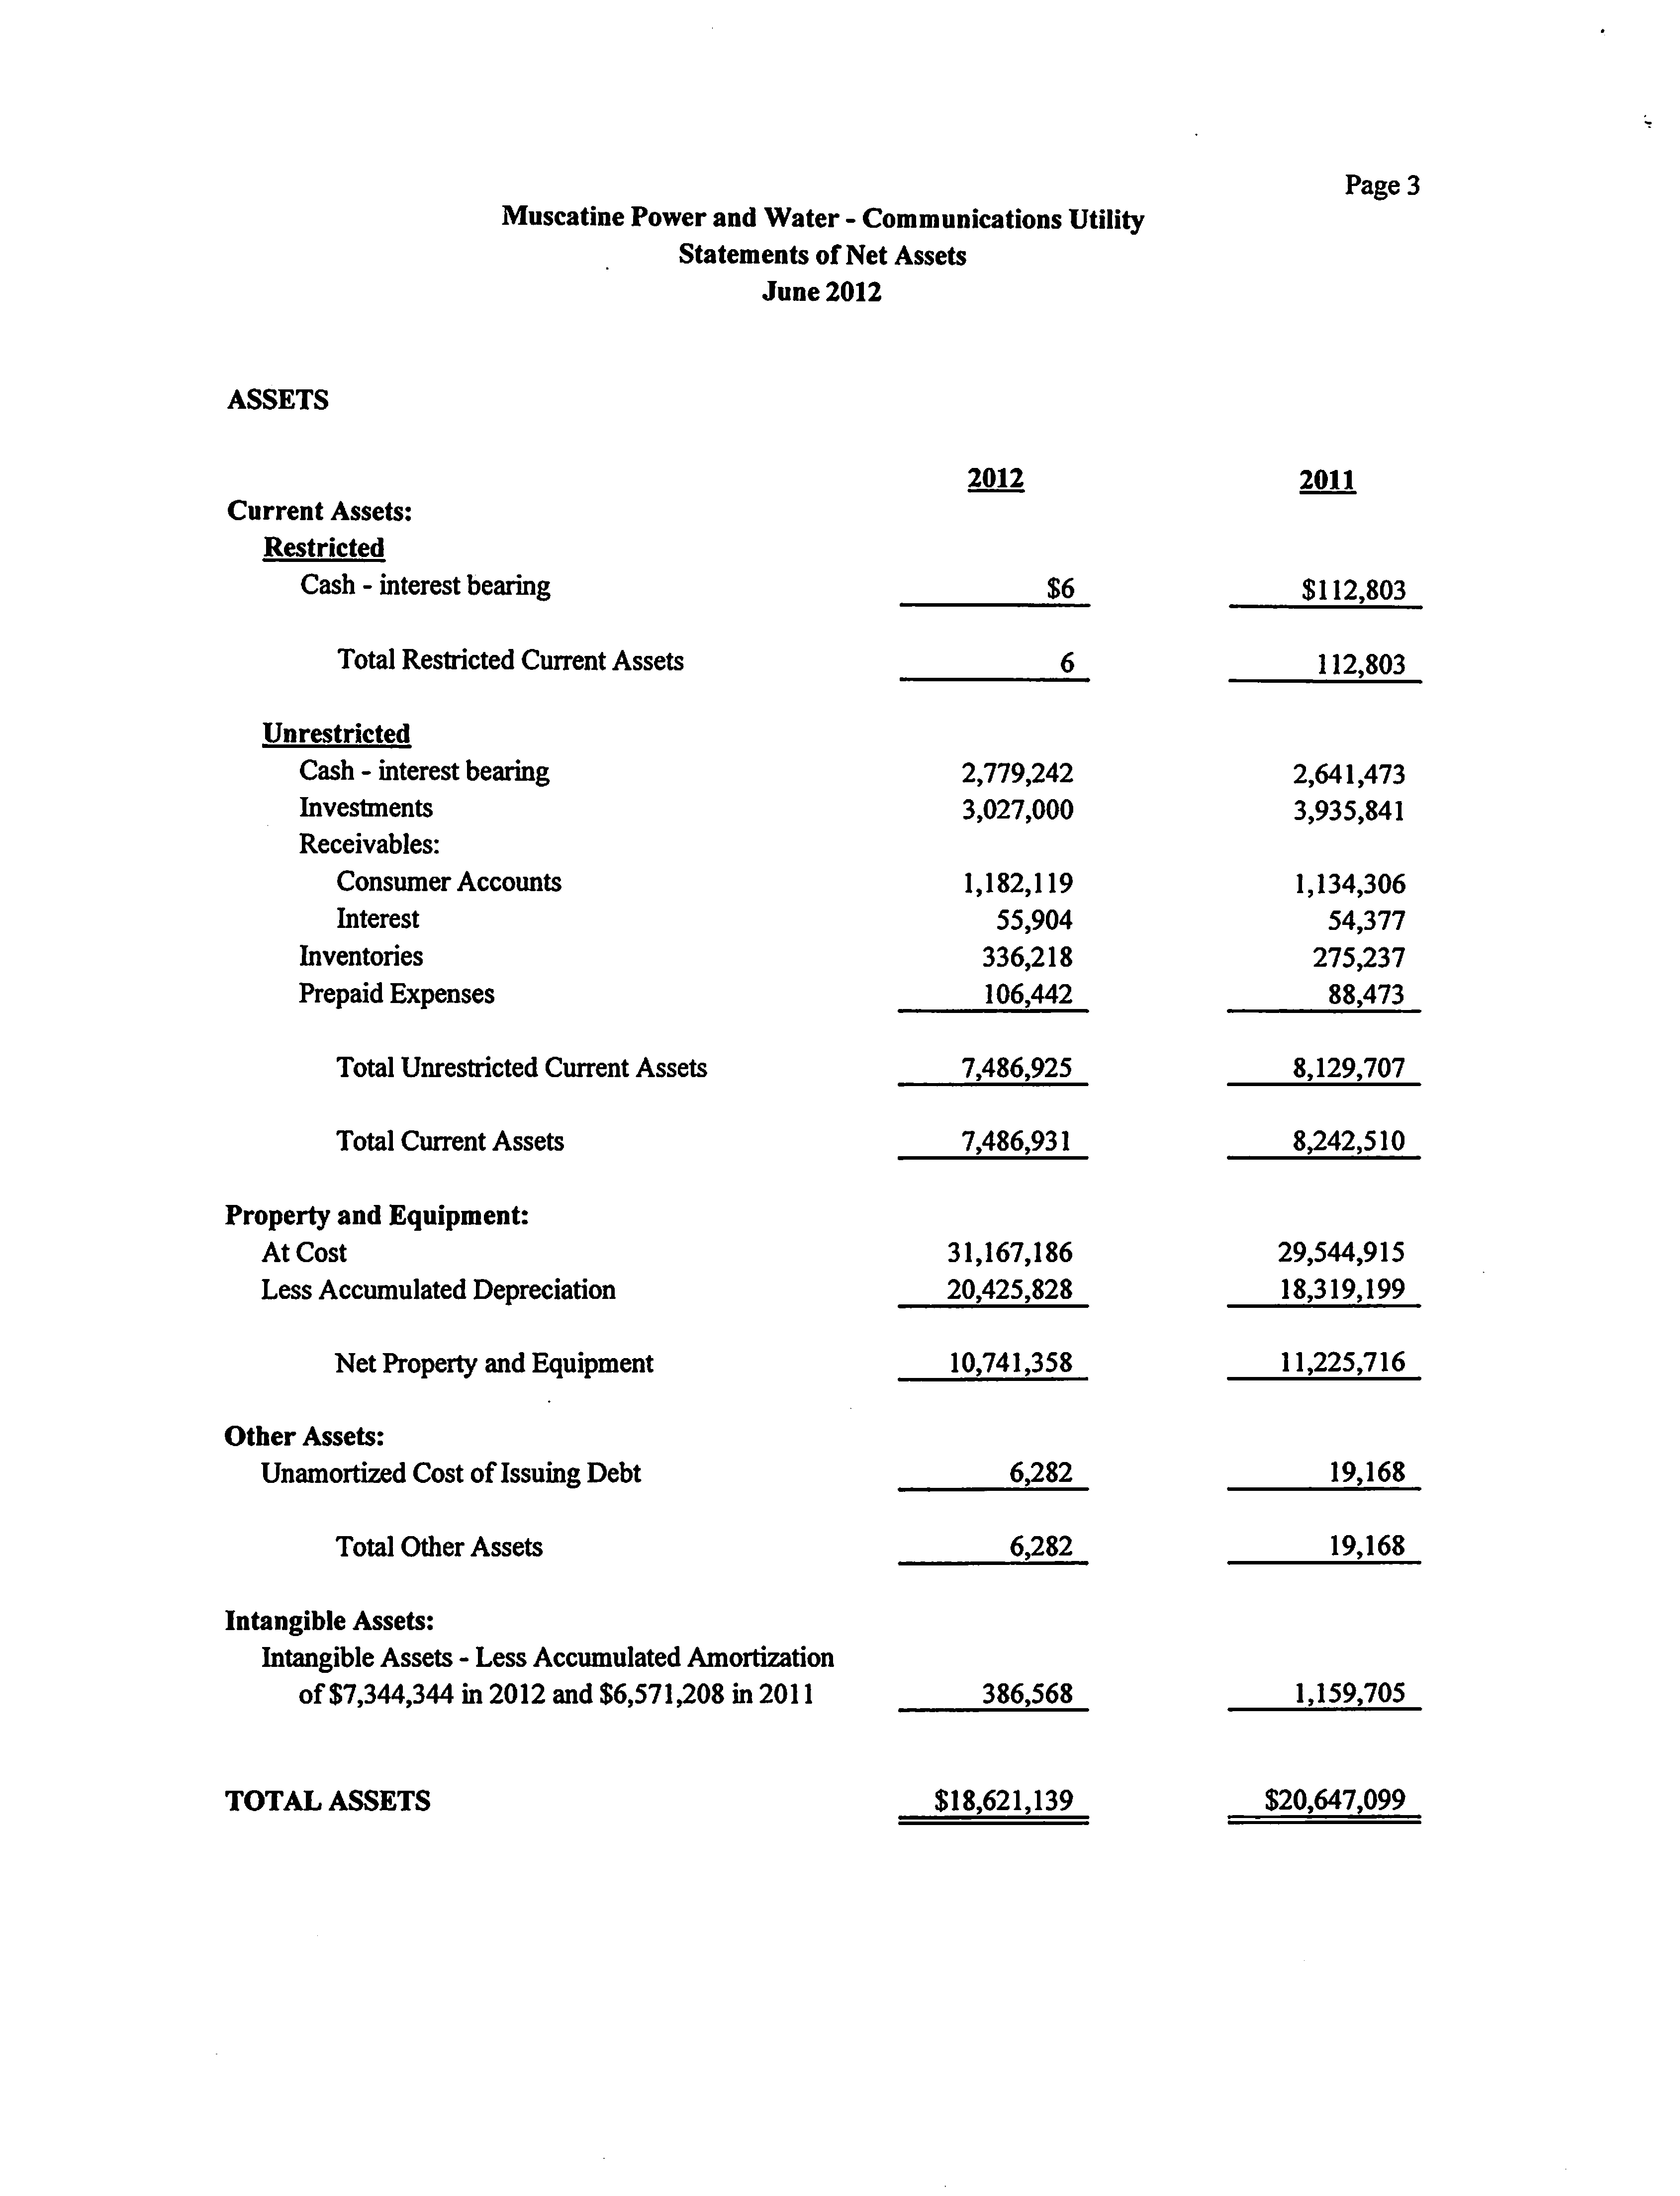
Muscatine Power and Water - Communications Utility
Statements of Net Assets
June 2012
Page 3
ASSETS
2012
2011
Current
Assets:
Restricted
Cash - interest bearing
$6_
$112,803
Total Restricted Current Assets
Unrestricted
Cash - interest bearing
Investments
Receivables:
Consumer Accounts
Interest
Inventories
Prepaid Expenses
Total Unrestricted Current Assets
Total Current Assets
Property and Equipment:
At Cost
Less Accumulated Depreciation
Net Property and Equipment
Other
Assets:
Unamortized Cost of Issuing Debt
6,282
19,168
Total Other Assets
6,282
19,168
6
112,803
2,779,242
2,641,473
3,027,000
3,935,841
1,182,119
1,134,306
55,904
54,377
336,218
275,237
106,442
88,473
7,486,925
8,129,707
7,486,931
8,242,510
31,167,186
29,544,915
20,425,828
18,319,199
10,741,358
11,225,716
Intangible
Assets:
Intangible Assets - Less Accumulated Amortization
of $7,344,344 in 2012 and $6,571,208 in 2011
386,568
1,159,705
TOTAL ASSETS
$18,621,139
$20,647,099
Page 4
Muscatine Power and Water - Communications Utility
Statements of Net Assets
June 2012
LIABILITIES AND NET DEFICIT
Current Liabilities:
Restricted
Notes Payable - Banks
Accrued Interest
Total Restricted Current Liabilities
Unrestricted
Accrued Interest
Accounts Payable
Pension Provision
Health & Dental Insurance Provision
Intercompanies
Accrued Payroll
Accrued Vacation
Accrued Property Taxes
Deferred Revenue - Dark Fiber Lease
Miscellaneous Accrued Expenses
Total Unrestricted Current Liabilities
Total Current Liabilities
Non-Current Liabilities:
Health & Dental Insurance Provision
Post-Employment Health Benefit Provision
Deferred Revenue - Dark Fiber Lease
Notes Payable:
Banks
Electric Utility
Total Non-Current Liabilities
Net Deficit:
Invested in capital assets, net of related debt
Restricted
Unrestricted
Total Net Deficit
2012
2011
$915,000
885,000
92,002
112,800
1,007,002
997,800
623,522
622,922
512,580
388,250
154,540
137,688
34,889
41,124
12,119
11,539
47,776
31,503
132,108
116,216
21,625
25,242
17,500
16,991
142,248
139,201
1,698,907
1,530,676
2,705,909
2,528,476
157,109
200,014
26,755
23,397
308,229
326,238
3,000,000
3,915,000
35,327,000
35,327,000
38,819,093
39,791,649
7,225,716
7,610,978
(30,129,579)
(29,284,004)
(22,903,863)
(21,673,026)
TOTAL LIABILITIES AND NET DEFICIT
$18,621,139
$20,647,099
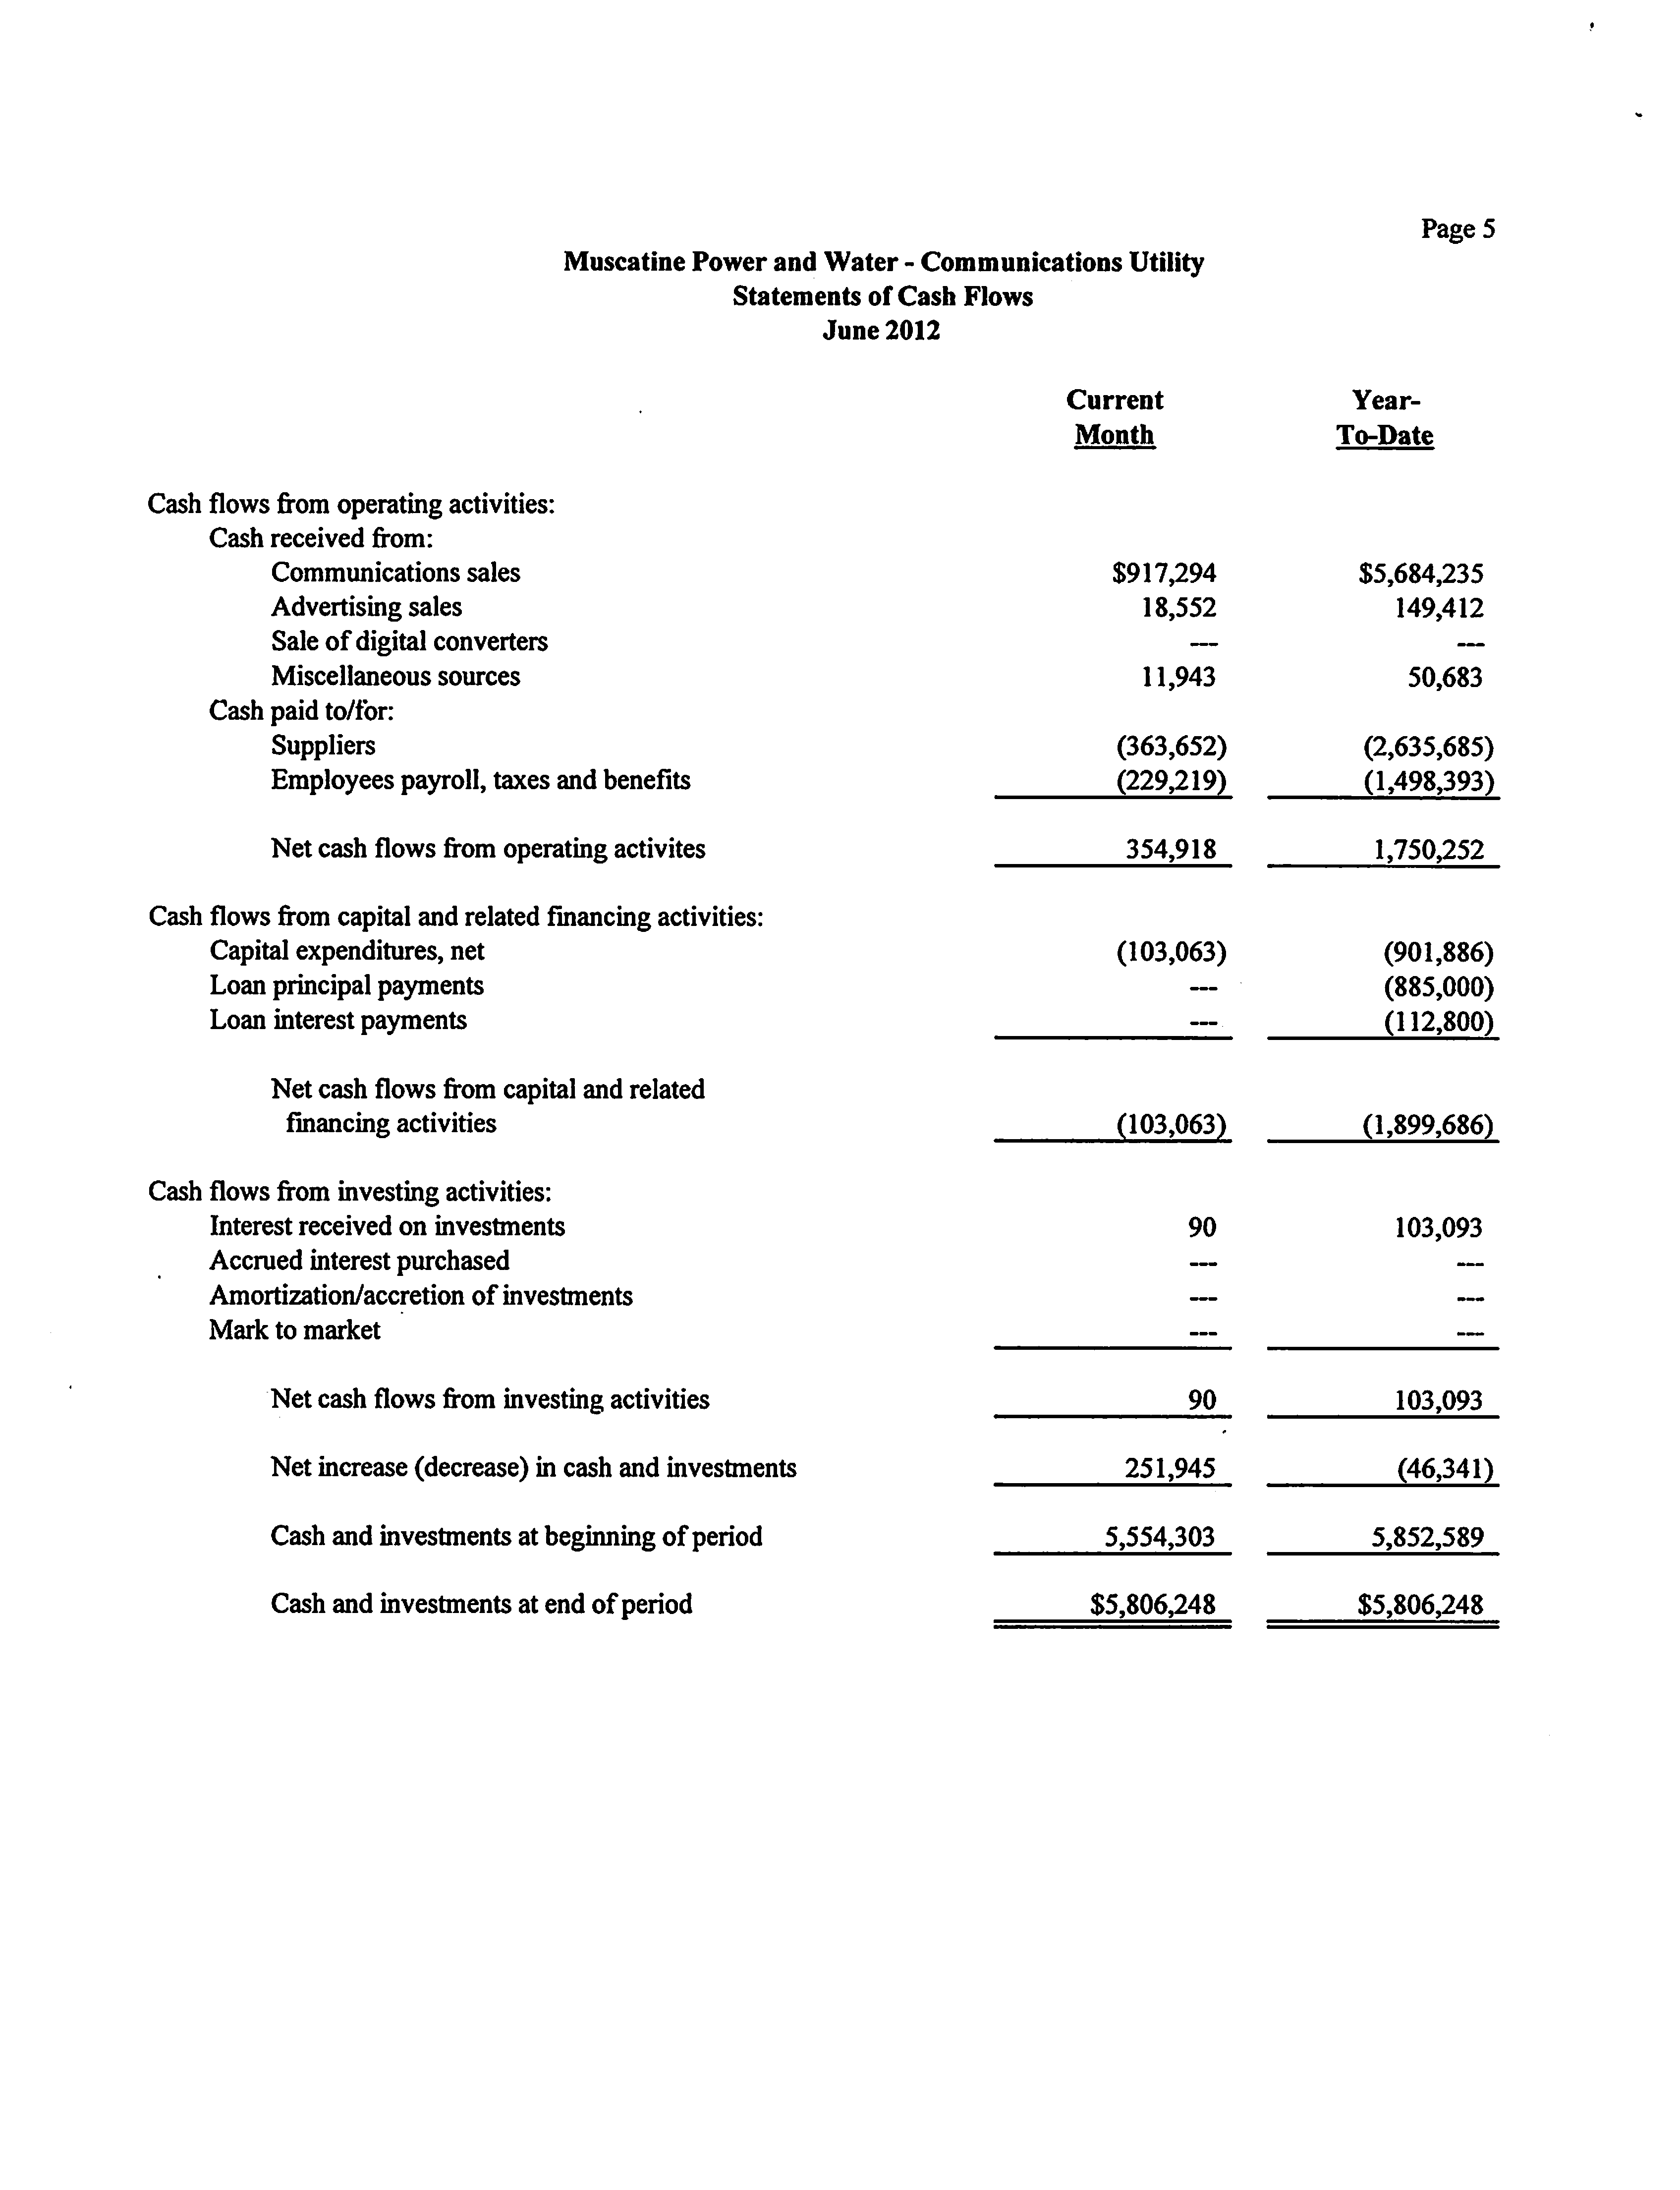
Page 5
Muscatine Power and Water - Communications Utility
Statements of Cash Flows
June 2012
Cash flows from operating activities:
Cash received from:
Communications sales
Advertising sales
Sale
of digital converters
Miscellaneous sources
Cash paid to/for:
Suppliers
Employees payroll, taxes and benefits
Net cash flows from operating activites
Cash flows from capital and related financing activities:
Capital expenditures, net
Loan principal payments
Loan interest payments
Net cash flows from capital and related
financing activities
Cash flows from investing activities:
Interest received on investments
Accrued interest purchased
Amortization/accretion of investments
Mark to market
Net cash flows from investing activities
Net increase (decrease) in cash and investments
Cash and investments at beginning of period
Cash and investments at end of period
Current
Month
$917,294
18,552
11,943
Year-
To-Date
$5,684,235
149,412
50,683
(363,652)
(229,219)
(2,635,685)
(1,498,393)
354,918
1,750,252
(103,063)
(901,886)
(885,000)
(112,800)
(103,063)
(1,899,686)
90
103,093
90
103,093
251,945
(46,341)
5,554,303
5,852,589
$5,806,248
$5,806,248
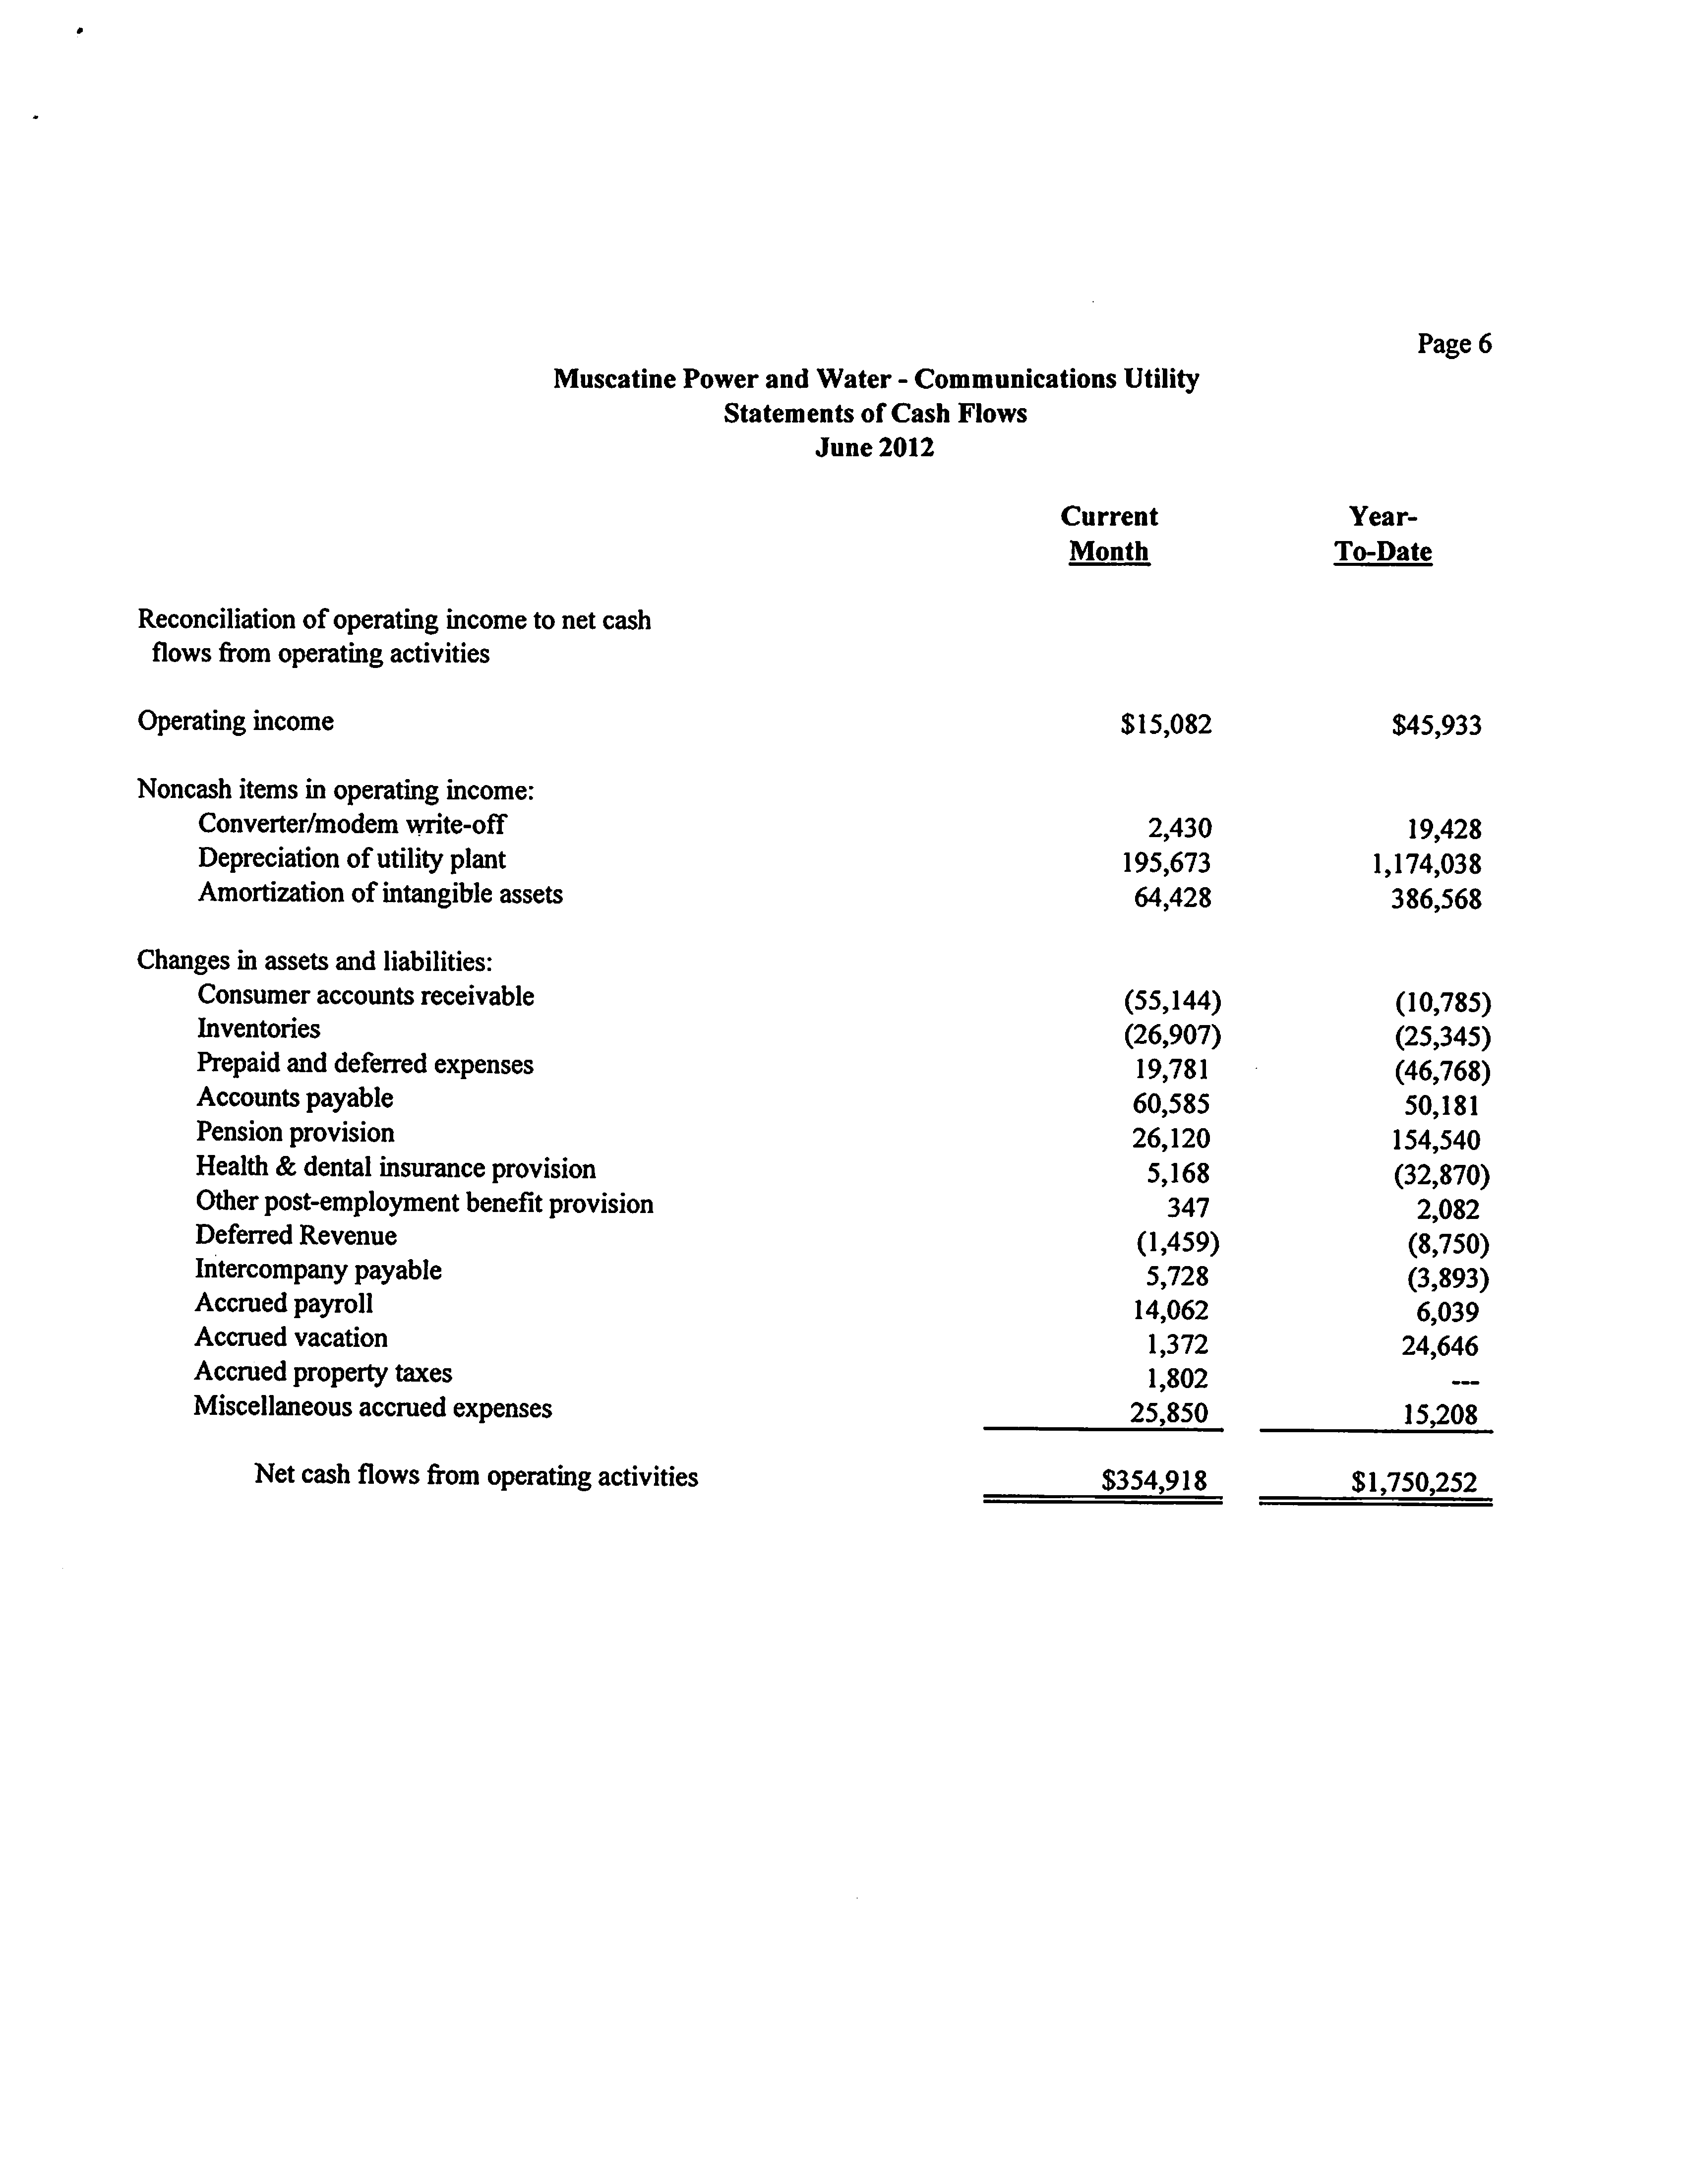
Muscatine Power and Water - Communications Utility
Statements of Cash Flows
June 2012
Page 6
Current
Year-
Month
To-Date
Reconciliation of operating income to net cash
flows from operating activities
Operating income
$15,082
$45,933
Noncash items in operating income:
Converter/modem write-off
Depreciation of utility plant
Amortization of intangible assets
Changes in assets and liabilities:
Consumer accounts receivable
Inventories
Prepaid and deferred expenses
Accounts payable
Pension provision
Health & dental insurance provision
Other
post-employment
benefit
provision
Deferred Revenue
Intercompany payable
Accrued payroll
Accrued vacation
Accrued property taxes
Miscellaneous
accrued
expenses
Net cash flows from operatingactivities
2,430
19,428
195,673
1,174,038
64,428
386,568
(55,144)
(10,785)
(26,907)
(25,345)
19,781
(46,768)
60,585
50,181
26,120
154,540
5,168
(32,870)
347
2,082
(1,459)
(8,750)
5,728
(3,893)
14,062
6,039
1,372
24,646
1,802
—
25,850
15,208
$354,918
$1,750,252
Muscatine Powerand Water - Communications Utility
Summary
of
Expenses
Current Month - June 2012
Page 7
Budget
Estimate
This Year
Last Year
CATV
Program Acquisition Expense
$336,051
$343,148
$303,110
PromotionalExpense
6,138
1,532
2,694
ElectricityExpense
2,181
2,358
2,263
Pole Attachment Expense
2,167
2,167
2,167
Changes of Service
1,468
1,094
1,125
Underground Line Expense
2,608
2,081
3,438
Ad Insertion - Marketing/Production
7,106
4,497
6,662
Miscellaneous CATV Expense
13,292
14,406
12,037
Vehicle Expense
5,434
6,017
4,933
Maintenance:
Fiber
1,655
262
7,252
Coax
1,853
3,817
2,516
Drops
3,601
2,317
3,147
Conduit System
306
493
213
Headend
24,379
22,699
20,657
Line Equipment
3,237
1,706
3,333
Converters
6,597
5,220
5,005
Ad Insertion
3,848
3,588
4,063
Vacation, Holiday, Sick Leave
3,722
3,710
3,425
Property Taxes
1,188
1,188
1,400
Depreciation
156,142
146,724
152,268
Amortization
48,321
48,321
48,321
Total CATV
631,294
617,345
590,029
Data/Internet
Data/Internet Access Charges
31,491
39,251
22,078
Promotional Expense
6,138
1,417
2,862
Electricity Expense
74
81
75
Pole Attachment Expense
75
75
75
Changes of Service
629
469
482
Customer Wireless Equipment Expense
394
2,883
145
Underground Line Expense
89
71
117
Miscellaneous Data/Internet Expense
8,490
9,888
8,356
Vehicle Expense
645
734
600
Maintenance:
Fiber
58
9
253
Coax
63
130
88
Drops
123
80
108
Conduit System
11
17
8
Headend
15,951
11,510
13,233
LineEquipment
no
58
114
Modems
4,830
5,853
4,191
Vacation, Holiday, Sick Leave
3,126
2,565
2,558
Property Taxes
41
41
49
Depreciation
21,946
20,183
21,599
Amortization
16,107
16,107
16,107
Total Data/Internet
$110,391
$111,422
$93,098
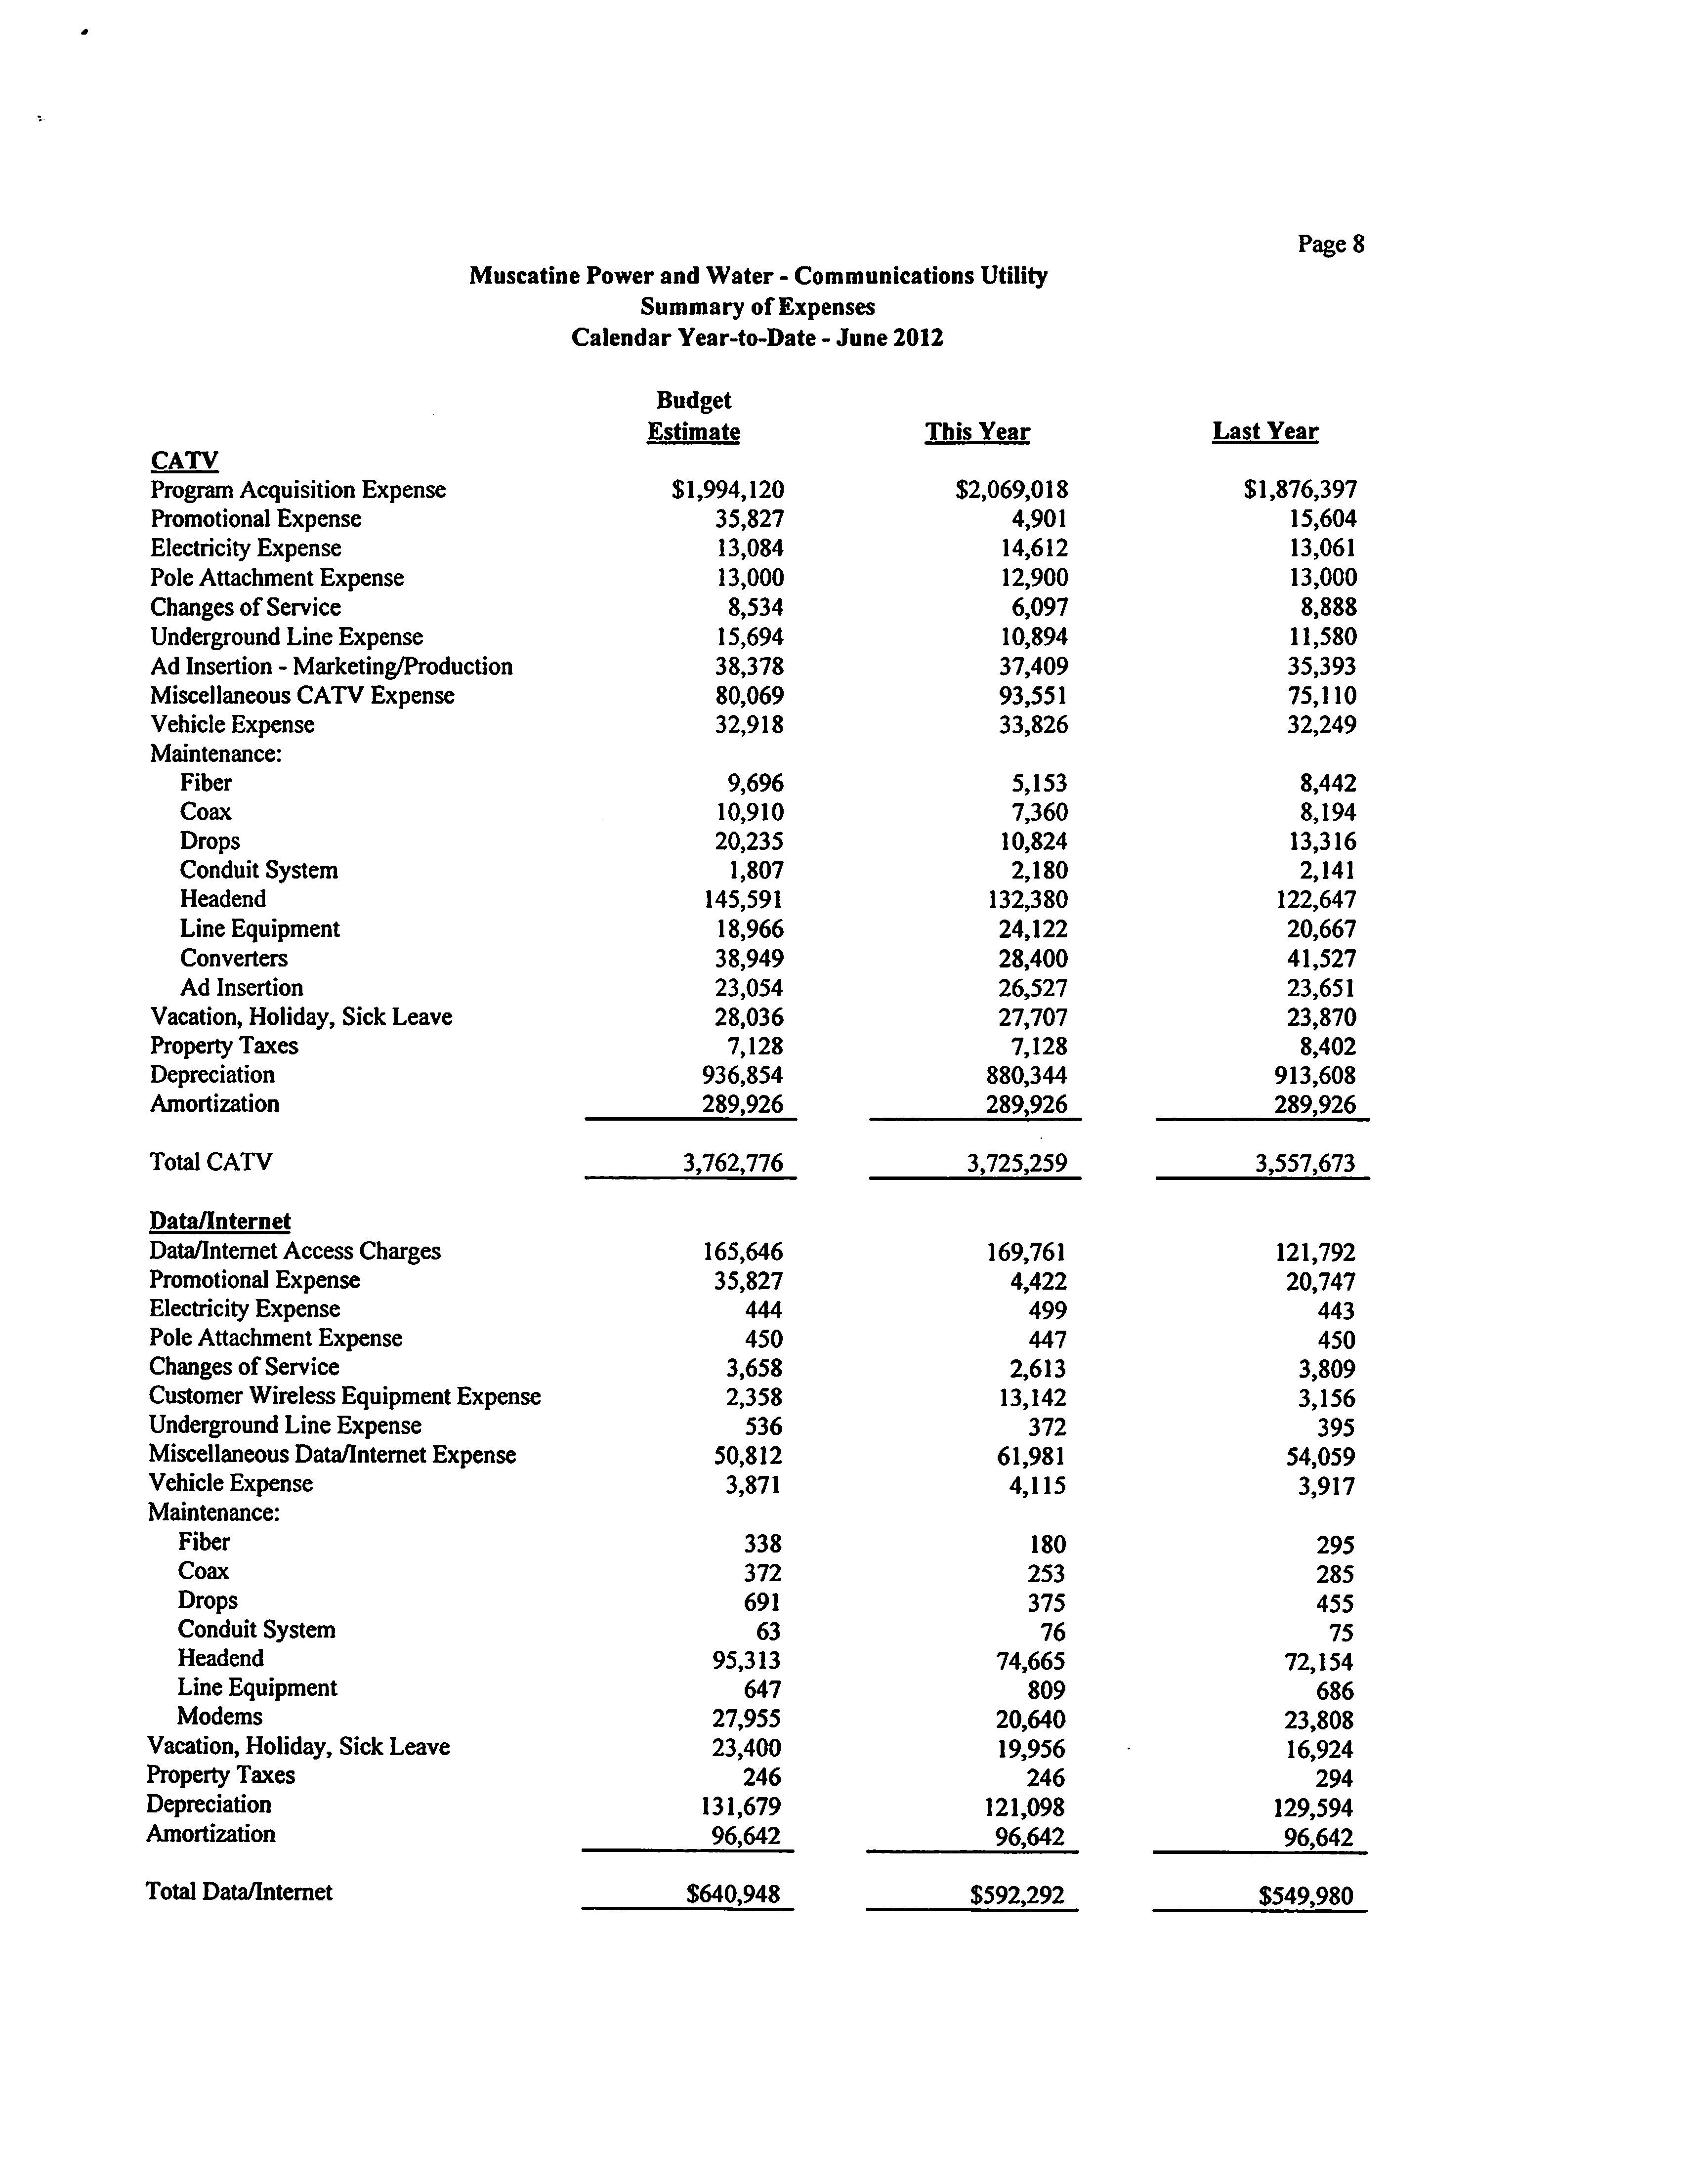
Page 8
Muscatine Power and Water - Communications Utility
Summary of Expenses
Calendar Year-to-Date - June 2012
Budget
Estimate
This Year
LastYear
CATV
Program Acquisition Expense
$1,994,120
$2,069,018
$1,876,397
Promotional Expense
35,827
4,901
15,604
Electricity Expense
13,084
14,612
13,061
Pole Attachment Expense
13,000
12,900
13,000
Changes of Service
8,534
6,097
8,888
Underground Line Expense
15,694
10,894
11,580
Ad Insertion - Marketing/Production
38,378
37,409
35,393
Miscellaneous CATV Expense
80,069
93,551
75,110
Vehicle Expense
32,918
33,826
32,249
Maintenance:
Fiber
9,696
5,153
8,442
Coax
10,910
7,360
8,194
Drops
20,235
10,824
13,316
Conduit System
1,807
2,180
2,141
Headend
145,591
132,380
122,647
Line Equipment
18,966
24,122
20,667
Converters
38,949
28,400
41,527
Ad Insertion
23,054
26,527
23,651
Vacation, Holiday, Sick Leave
28,036
27,707
23,870
Property Taxes
7,128
7,128
8,402
Depreciation
936,854
880,344
913,608
Amortization
289,926
289,926
289,926
Total CATV
3,762,776
3,725,259
3,557,673
Data/Internet
Data/Internet Access Charges
165,646
169,761
121,792
Promotional Expense
35,827
4,422
20,747
Electricity Expense
444
499
443
Pole Attachment Expense
450
447
450
Changes of Service
3,658
2,613
3,809
CustomerWireless Equipment Expense
2,358
13,142
3,156
Underground Line Expense
536
372
395
Miscellaneous Data/Internet Expense
50,812
61,981
54,059
Vehicle Expense
3,871
4,115
3,917
Maintenance:
Fiber
338
180
295
Coax
372
253
285
Drops
691
375
455
Conduit System
63
76
75
Headend
95,313
74,665
72,154
Line Equipment
647
809
686
Modems
27,955
20,640
23,808
Vacation, Holiday, Sick Leave
23,400
19,956
16,924
Property Taxes
246
246
294
Depreciation
131,679
121,098
129,594
Amortization
96,642
96,642
96,642
Total Data/Internet
$640,948
$592,292
$549,980
Muscatine Power and Water
- Communications
Utility
Summary
of
Expenses
Current Month
-
June 2012
Page 9
MAN/MME
Pole Attachment Expense
Tools Expense
Maintenance:
Fiber
Conduit System
MAN/MME Equipment
Vacation, Holiday, Sick Leave
Property Taxes
Depreciation
Total MAN/MME
Customer Service Expense
Customer Information Expense
Consumer Accounts
Supervision
Consumer Records and Collections
Uncollectible Accounts Expense
Vacation, Holiday, Sick Leave
Total Consumer Accounts
Administrative and General
Administrative and General Salaries
Office Supplies and Expense
Outside Services Employed
Property Insurance
Casualty Ins, Injuries & Damages
Employee Pensions and Benefits
Fringe Benefits Charges to Construction
Rents
Miscellaneous General Expense
Maintenance of General Plant
Vacation, Holiday, Sick Leave
Depreciation
Total Administrative and General
Total Operating Expenses
Budget
Estimate
This Year
Last Year
$1,042
$1,042
$1,042
542
72
34
798
126
3,499
147
238
103
1,945
5,439
—
111
95
91
573
573
676
20,293
20,341
16,892
25,451
27,926
22,337
19,874
8,418
5,159
2,433
2,510
2,796
37,626
35,744
34,677
2,871
2,871
1,383
3,182
3,694
3,385
46,112
44,819
42,241
53,746
52,324
51,394
5,133
4,842
4,388
6,083
4,375
5,962
977
971
809
5,094
7,341
4,106
76,430
76,204
74,167
(5,809)
(7,180)
(4,805)
8,727
8,727
7,952
9,426
14,059
15,480
2,446
3,393
4,055
6,634
4,677
5,202
8,578
8,425
7,564
177,465
178,158
176,274
$1,010,587
$988,088
$929,138
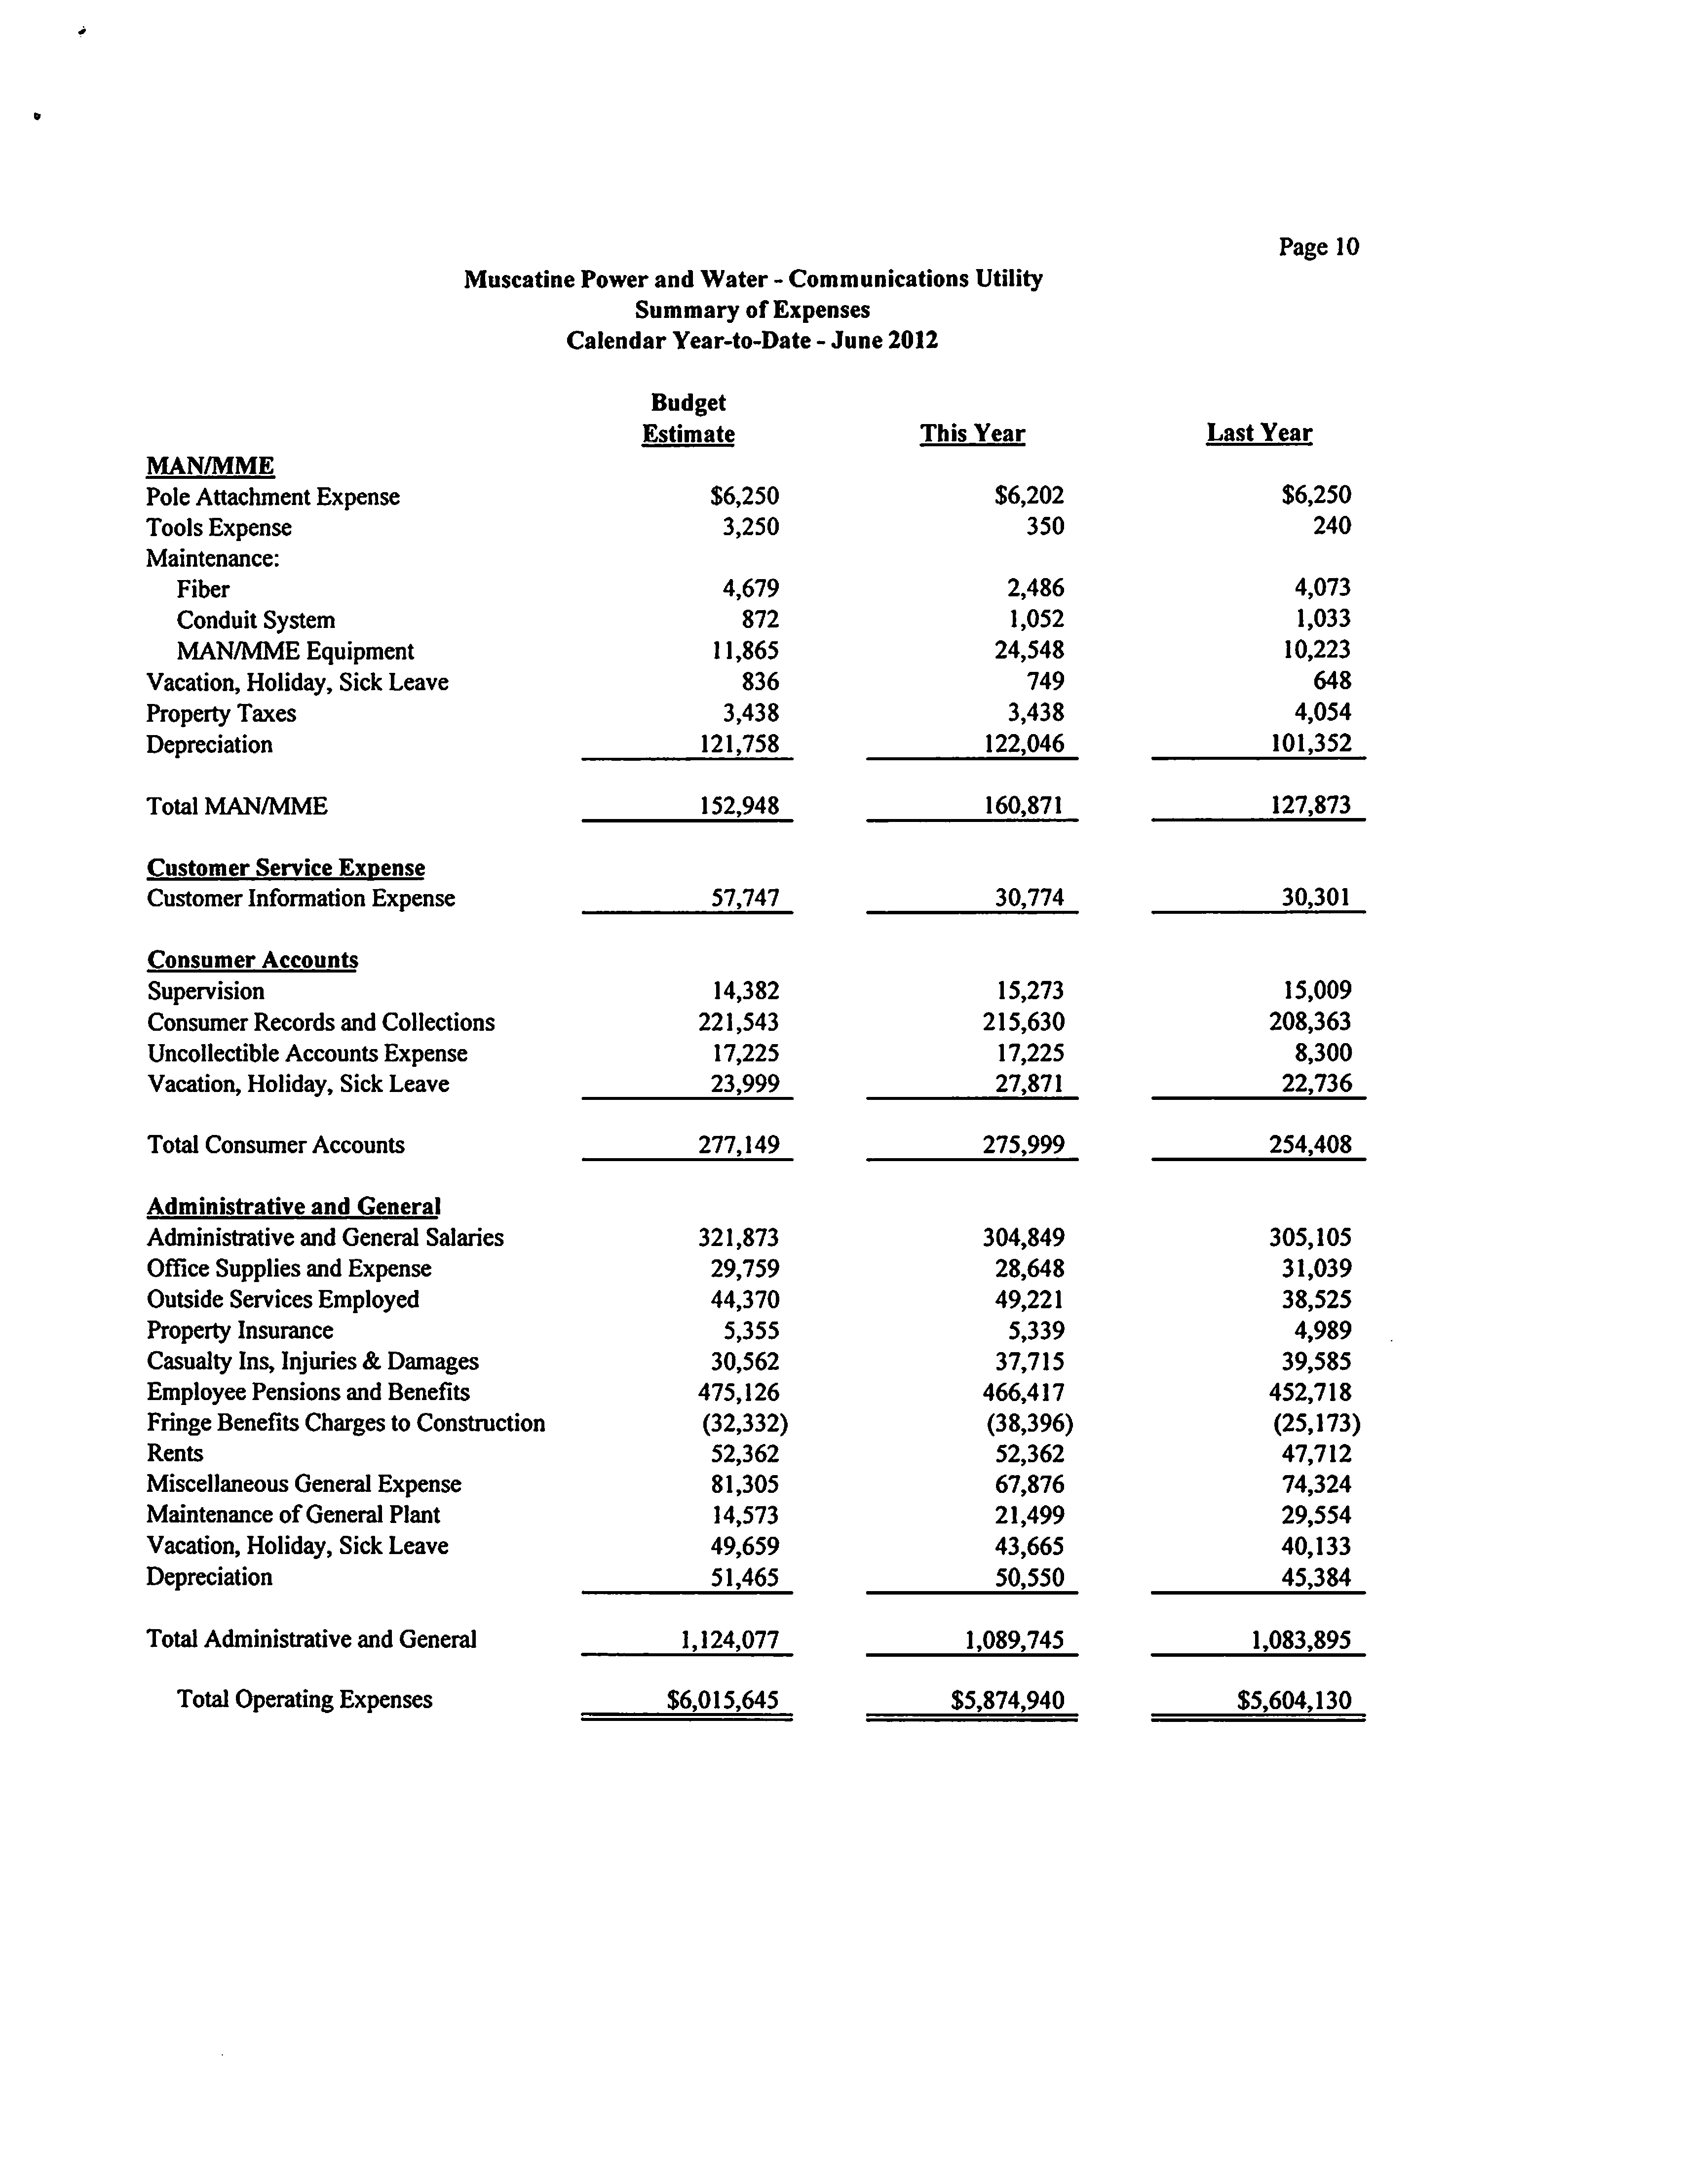
Page 10
Muscatine Power and Water - Communications Utility
Summary of Expenses
Calendar Year-to-Date - June 2012
Budget
Estimate
This Year
LastYear
MAN/MME
Pole Attachment Expense
$6,250
$6,202
$6,250
Tools Expense
3,250
350
240
Maintenance:
Fiber
4,679
2,486
4,073
Conduit System
872
1,052
1,033
MAN/MME Equipment
11,865
24,548
10,223
Vacation, Holiday, Sick Leave
836
749
648
Property Taxes
3,438
3,438
4,054
Depreciation
121,758
122,046
101,352
Total MAN/MME
152,948
160,871
127,873
Customer Service Expense
Customer Information Expense
57,747
30,774
30,301
Consumer Accounts
Supervision
14,382
15,273
15,009
Consumer Records and Collections
221,543
215,630
208,363
Uncollectible Accounts Expense
17,225
17,225
8,300
Vacation, Holiday, Sick Leave
23,999
27,871
22,736
Total Consumer Accounts
277,149
275,999
254,408
Administrative and General
Administrative and General Salaries
321,873
304,849
305,105
Office Supplies and Expense
29,759
28,648
31,039
Outside Services Employed
44,370
49,221
38,525
Property Insurance
5,355
5,339
4,989
Casualty Ins, Injuries & Damages
30,562
37,715
39,585
Employee Pensions and Benefits
475,126
466,417
452,718
Fringe Benefits Charges to Construction
(32,332)
(38,396)
(25,173)
Rents
52,362
52,362
47,712
Miscellaneous General Expense
81,305
67,876
74,324
Maintenance of General Plant
14,573
21,499
29,554
Vacation, Holiday, Sick Leave
49,659
43,665
40,133
Depreciation
51,465
50,550
45,384
Total Administrative and General
1,124,077
1,089,745
1,083,895
Total Operating Expenses
$6,015,645
$5,874,940
$5,604,130
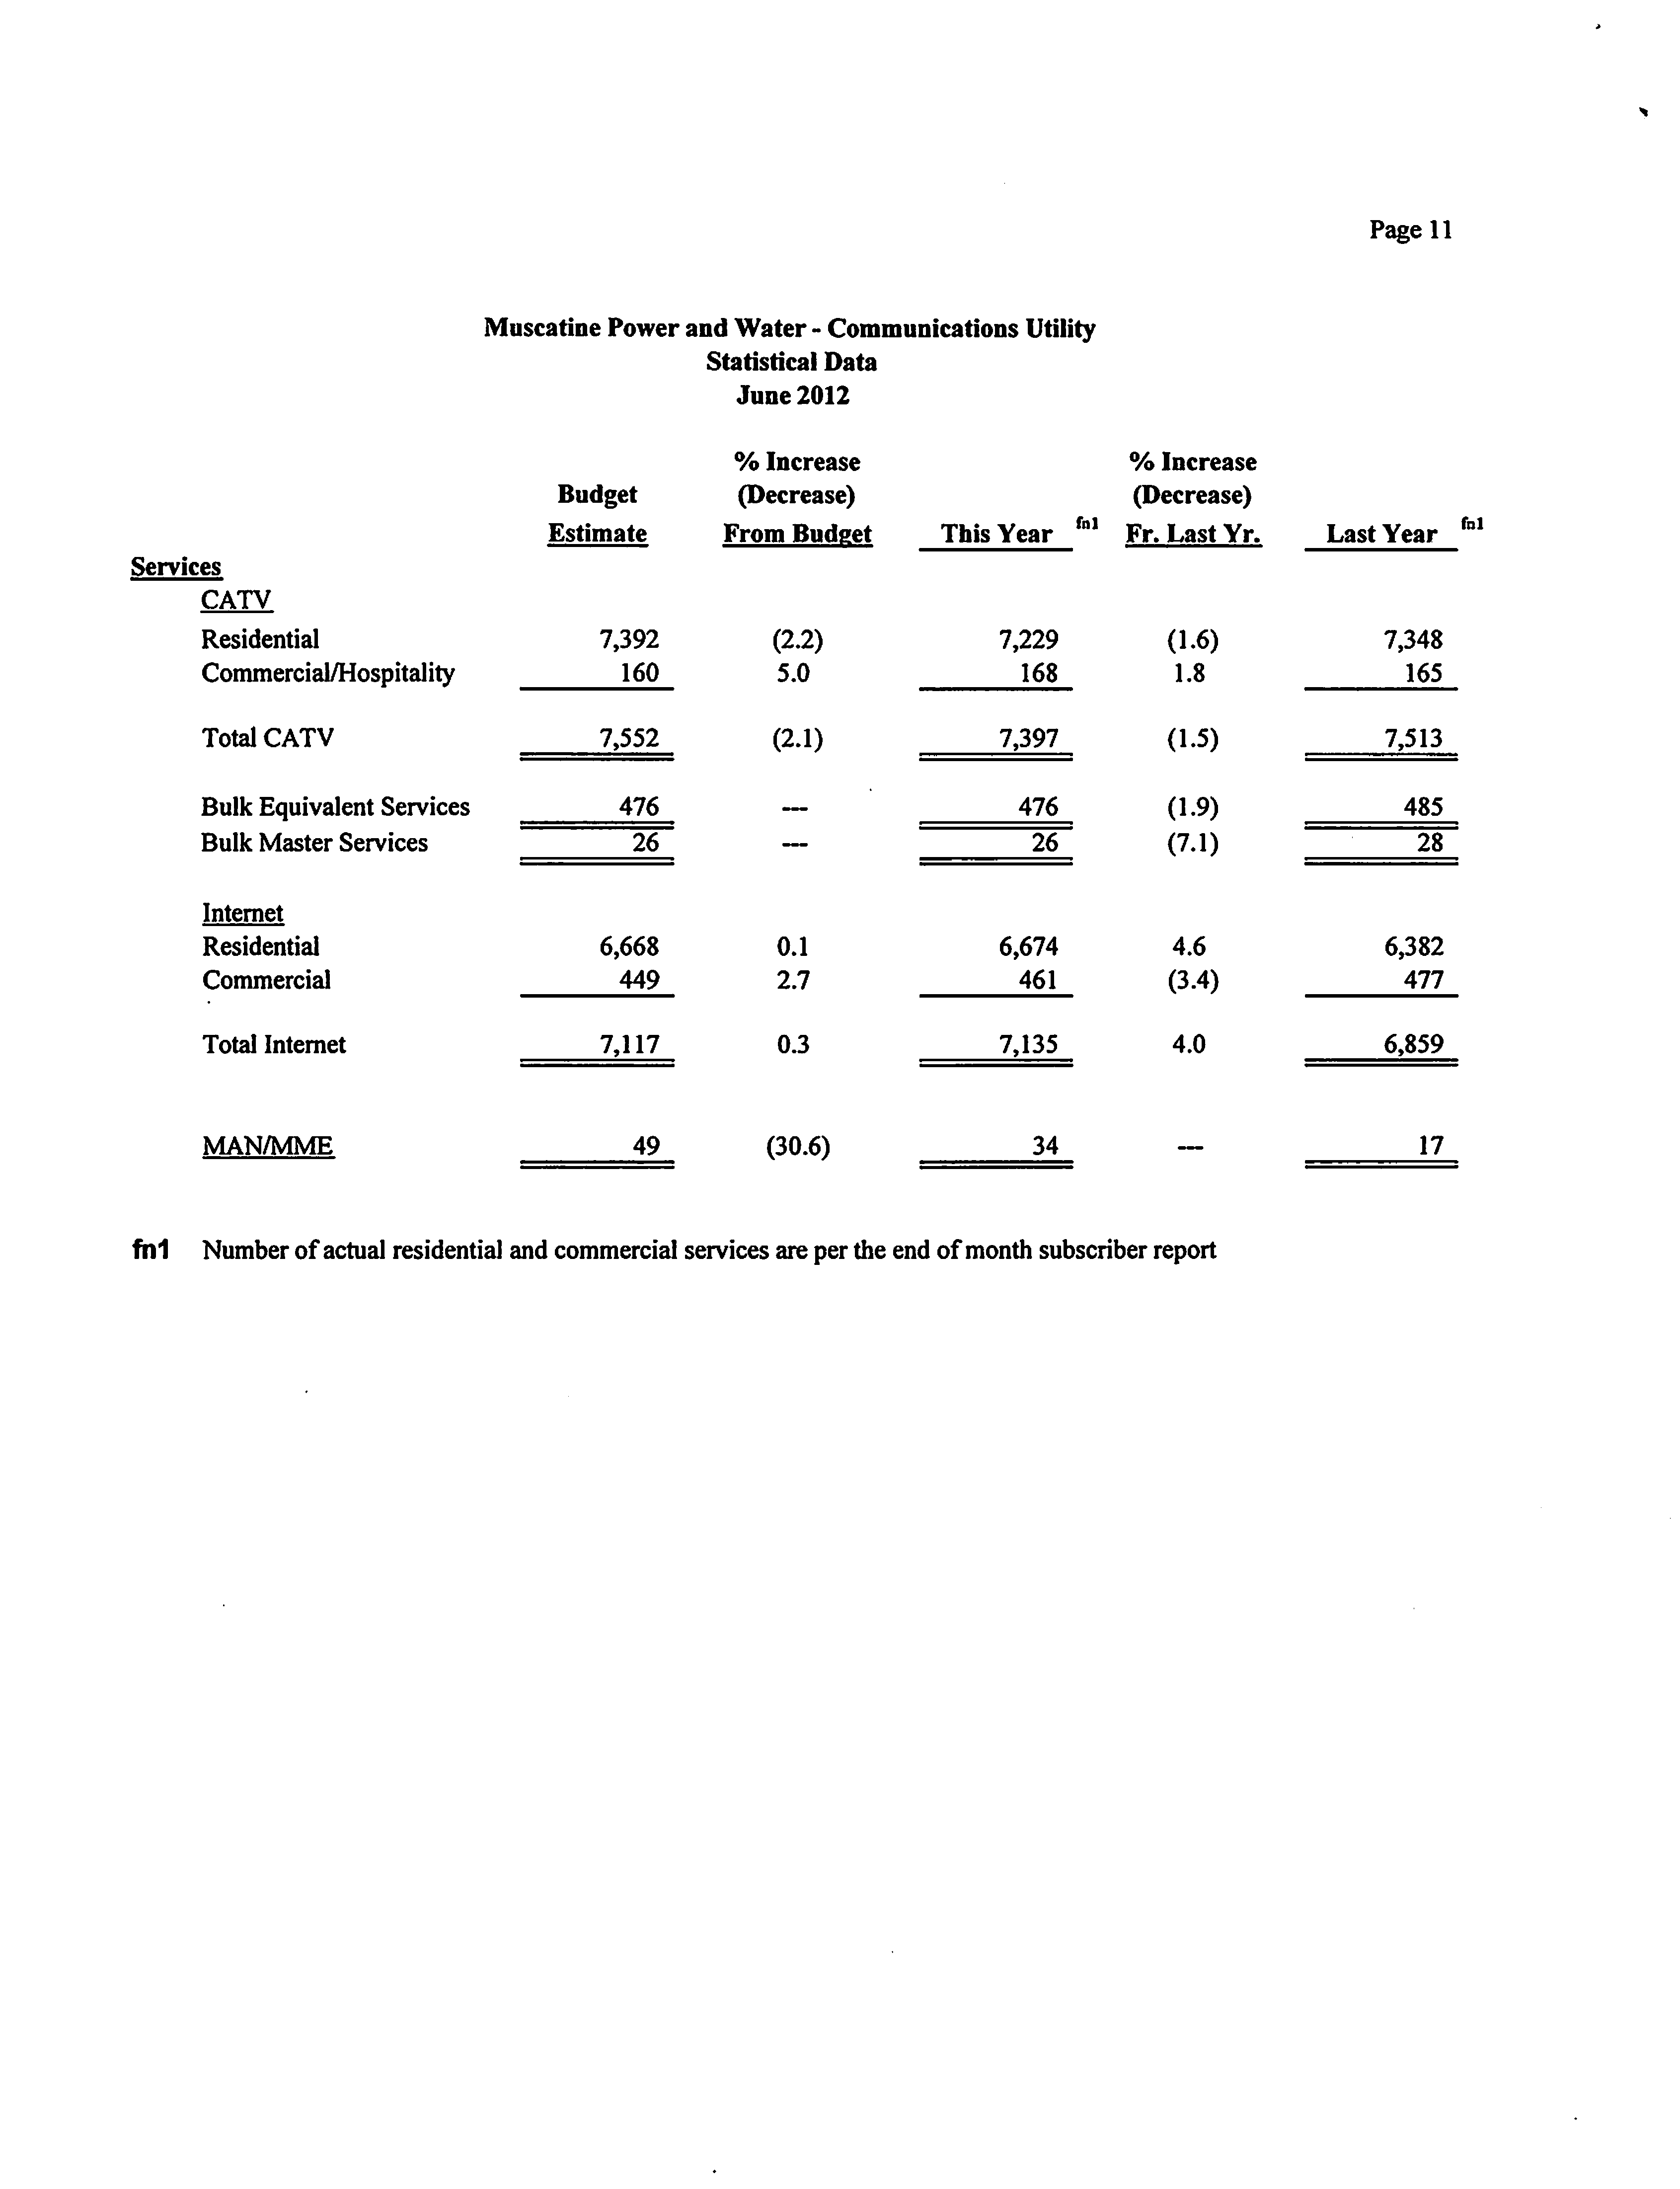
Muscatine Power and Water - Communications Utility
Statistical Data
June 2012
Page 11
fnl
% Increase
% Increase
Budget
(Decrease)
(Decrease)
Estimate
From Budget
This Year fnl Fr. Last Yr.
Last Year
Services
CATV
Residential
7,392
(2.2)
7,229
(1.6)
7,348
Commercial/Hospitality
160
5.0
168
1.8
165
Total CATV
7,552
(2.1)
7,397
(1.5)
7,513
Bulk Equivalent Services
476
—
476
(1.9)
485
Bulk Master Services
26
—
26
(7.1)
28
Internet
Residential
6,668
0.1
6,674
4.6
6,382
Commercial
449
2.7
461
(3.4)
477
Total Internet
7,117
0.3
7,135
4.0
6,859
MAN/MME
49
(30.6)
34
—
17
fnl
Number of actual residential and commercial services are per the end of month subscriber report